Njord Analytics + Njord Player
A full day of sailing, from first upload to final debrief.
Njord Analytics and Njord Player are designed to work together. Here's what that looks like in practice — and why most serious teams end up using both.
Log it as it happens.
Your instruments handle the data. But the moments that matter — a bad tack, a good start, a sail change that felt fast — are easy to miss when you're reviewing hours of data later. Njord's Live Coach Tools let you log comments, mark race times, and flag key moments from your phone as they happen, even without a signal. They're waiting in Analytics when you get back.
Running Expedition with 4G or Starlink? Live Data streams your boat's performance to any number of phones or tablets on the chase boat in real time — boatspeed, TWA, heel, and more, live as the boat sails.
What carries forward
Comments and time markers logged on the water appear automatically in Analytics when you upload — no copy-paste, no re-entry.
Upload once. The whole team is in.
Drop your log file into Njord Analytics — whatever format your instruments use, as-is. Races and legs are detected automatically from the data. Within minutes, everyone on the team has access via their own browser.
If you're training with partner boats, let them share their boat with you on Njord. Everything lands in the same event, and you can start comparing boats immediately — maneuver by maneuver, leg by leg.
What carries forward
The race structure — boats, events, races, legs, maneuvers — is now organised in Analytics and ready to pass directly to Player. You won't re-import or re-configure anything.
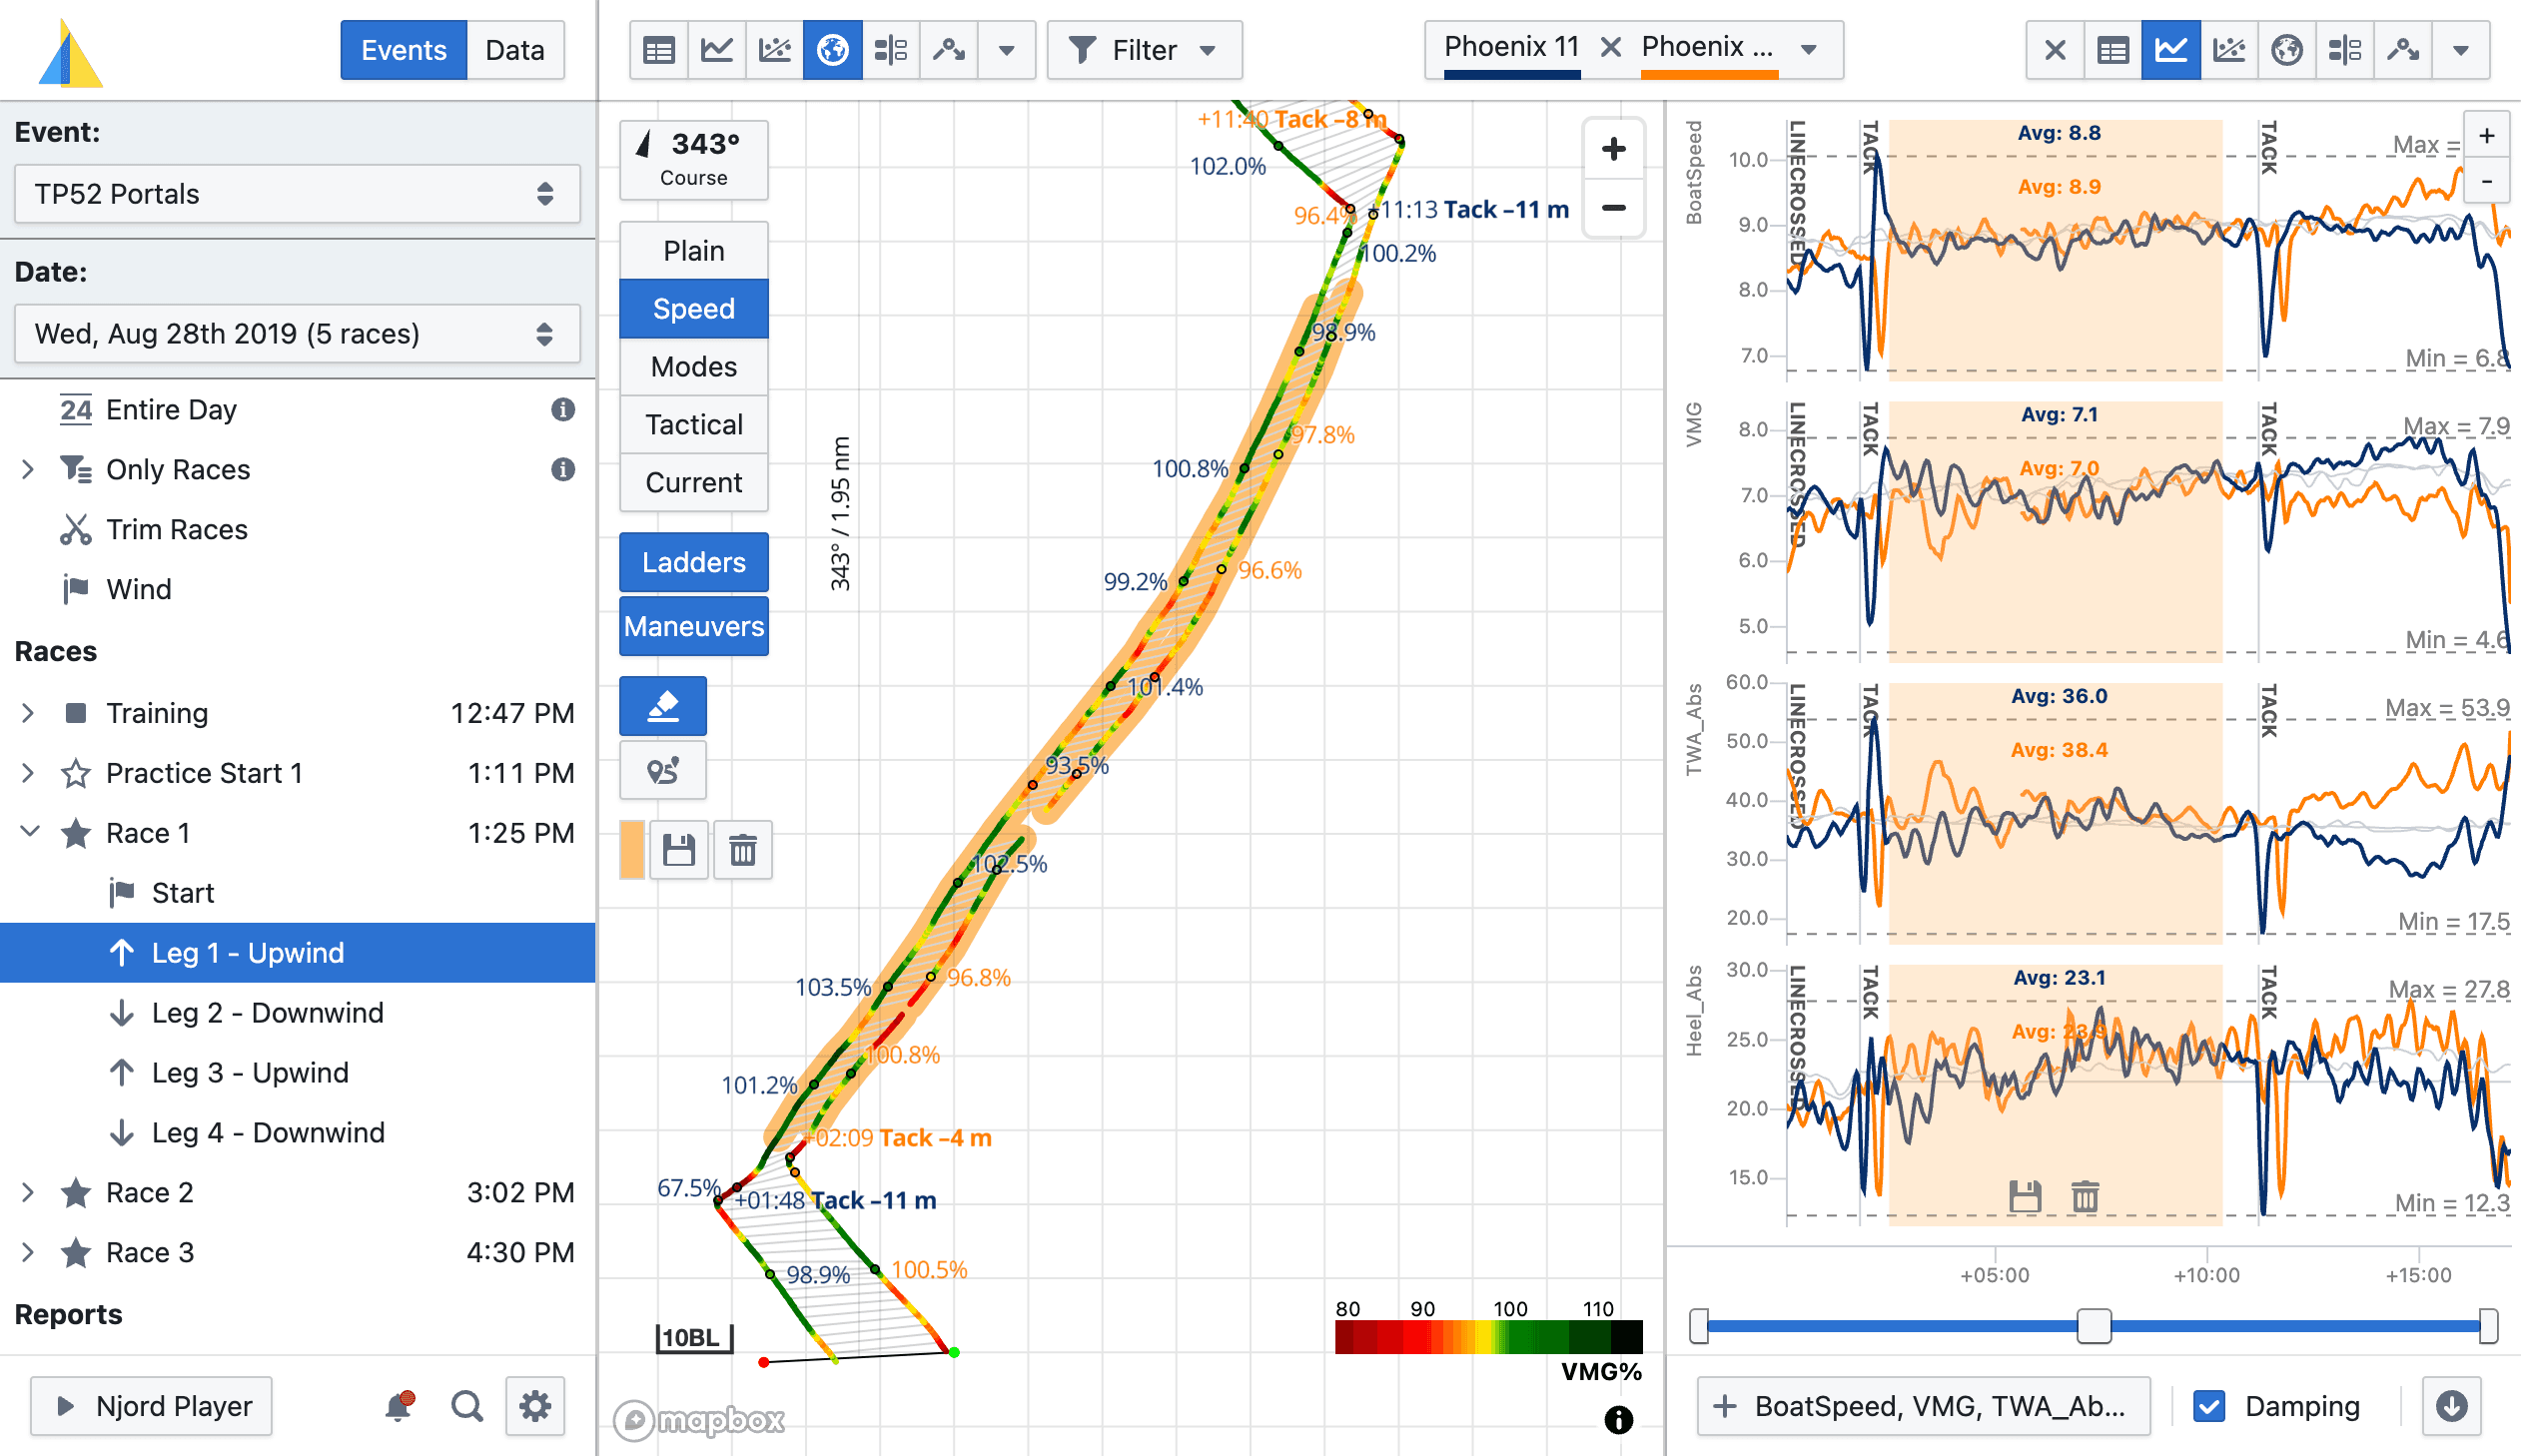
Explore the data. Find the story.
While the footage is being loaded, Analytics is already open. Click into the second upwind. Pull up the maneuver comparison. Overlay boatspeed and heel on the tactical map. You're not hunting for the right moment — you're already there, because races and legs are waiting the moment you open the event.
What carries forward
Any comments you added on the water — or annotate now in Analytics — appear as markers in Player. The same timestamps, the same moments, in both tools.
Your data is already there. Just add the footage.
Open Njord Player — in your browser via Njord Web Player, or as the desktop app on Windows or Mac. Use the 'Download from Analytics' option and your boat data, race structure, and comments load straight in. No separate log file import.
Then drop in your media. Njord reads the timestamps from your files and aligns everything automatically, down to the sub-second. For most sessions this takes a few minutes. If a camera's clock was off, you can adjust all its files in one step.
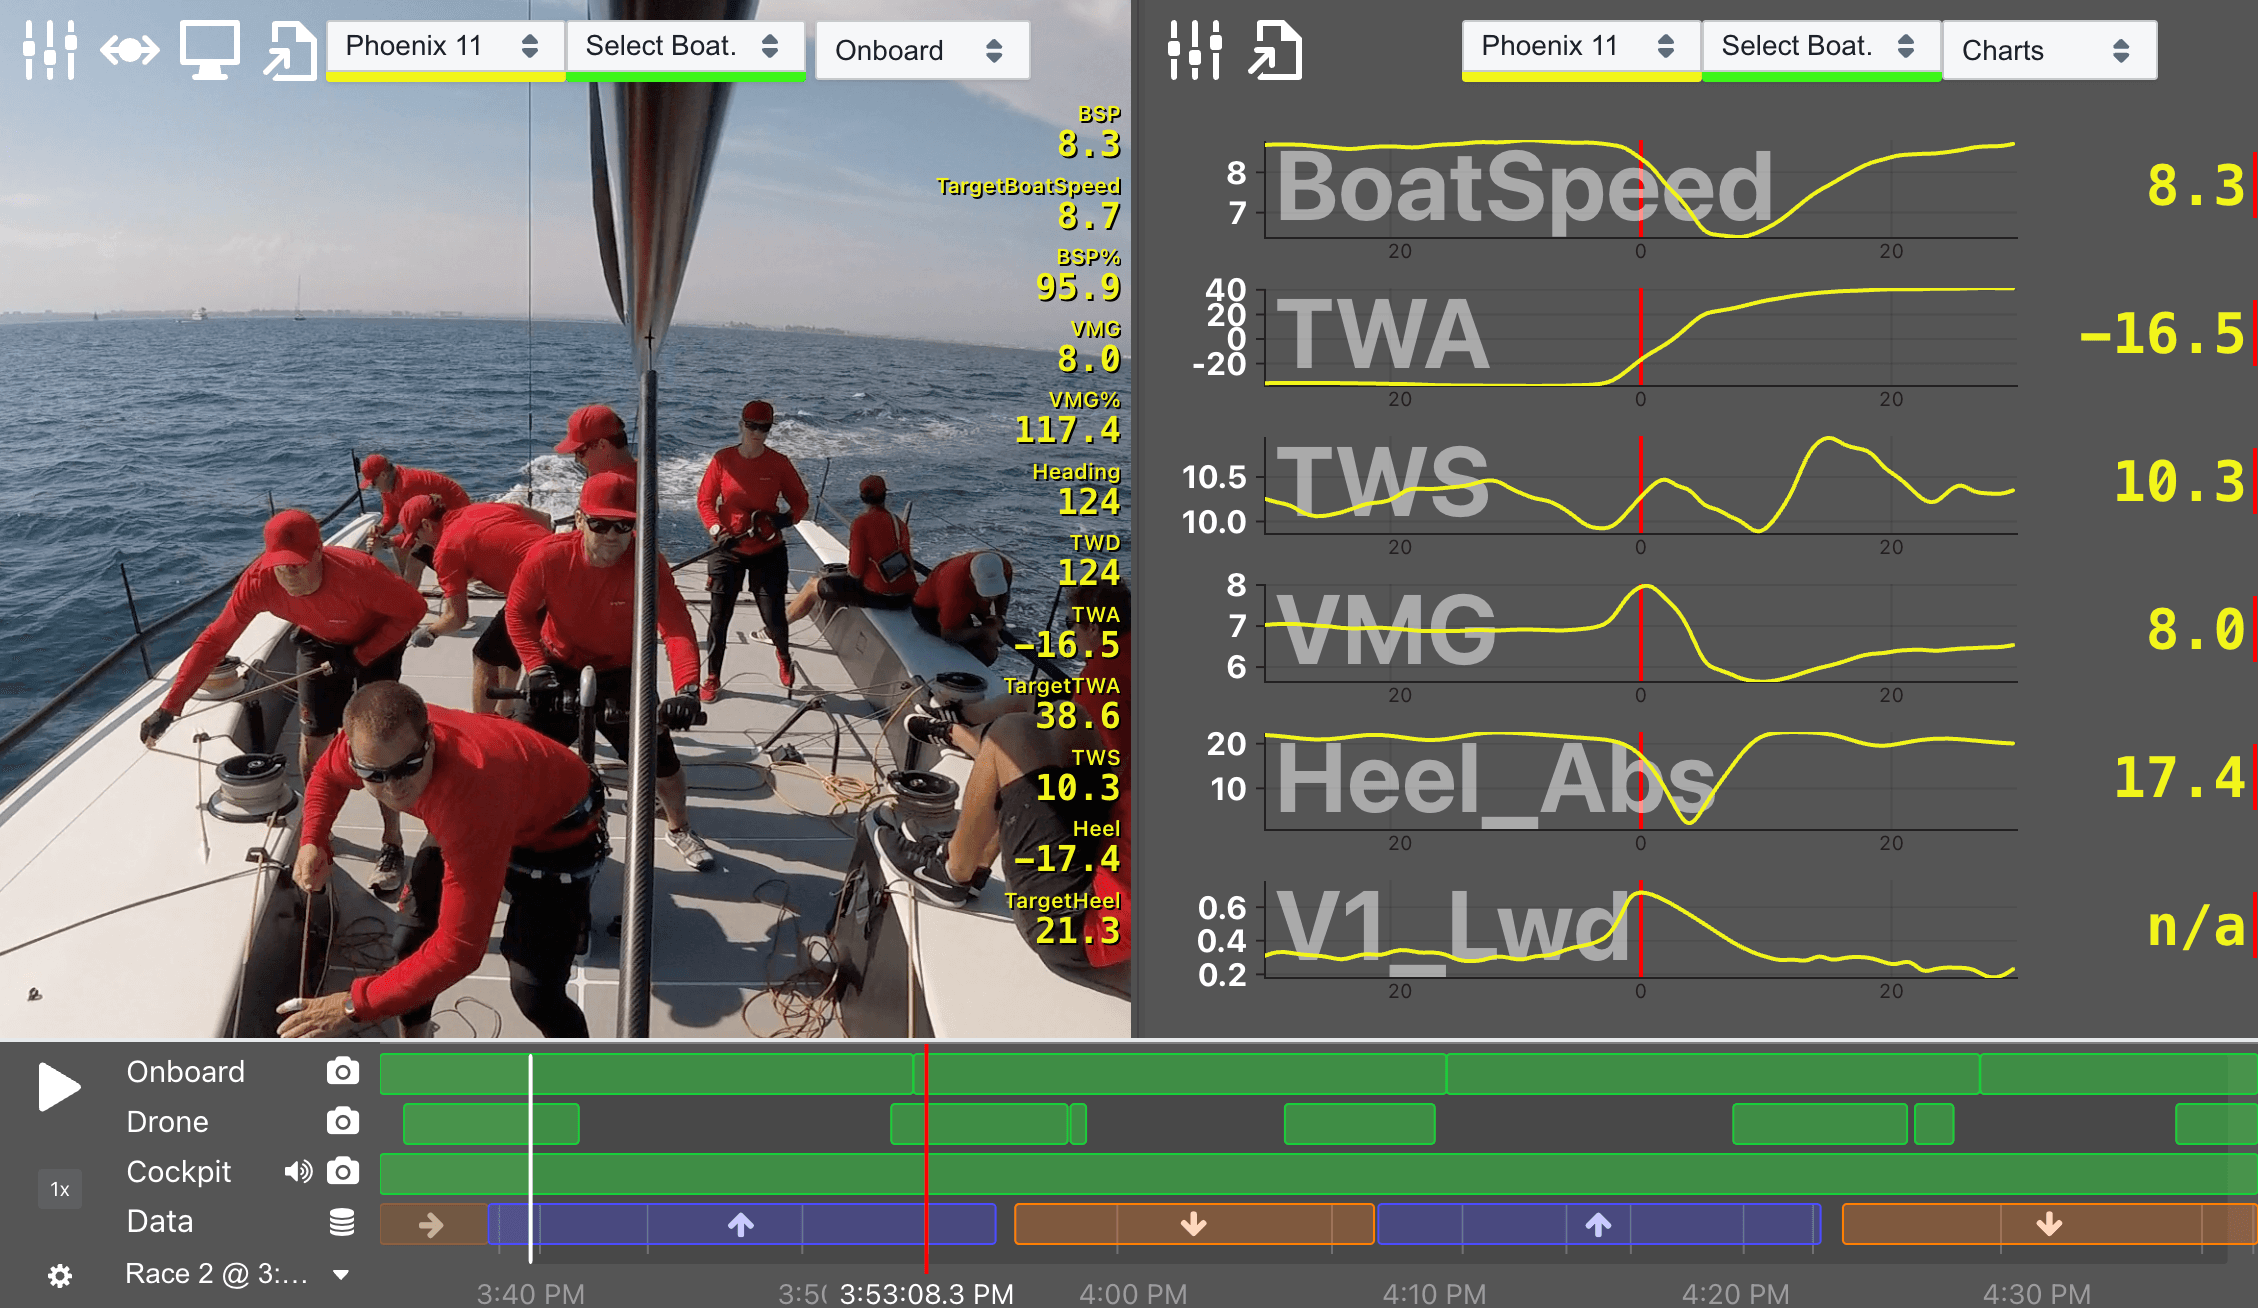
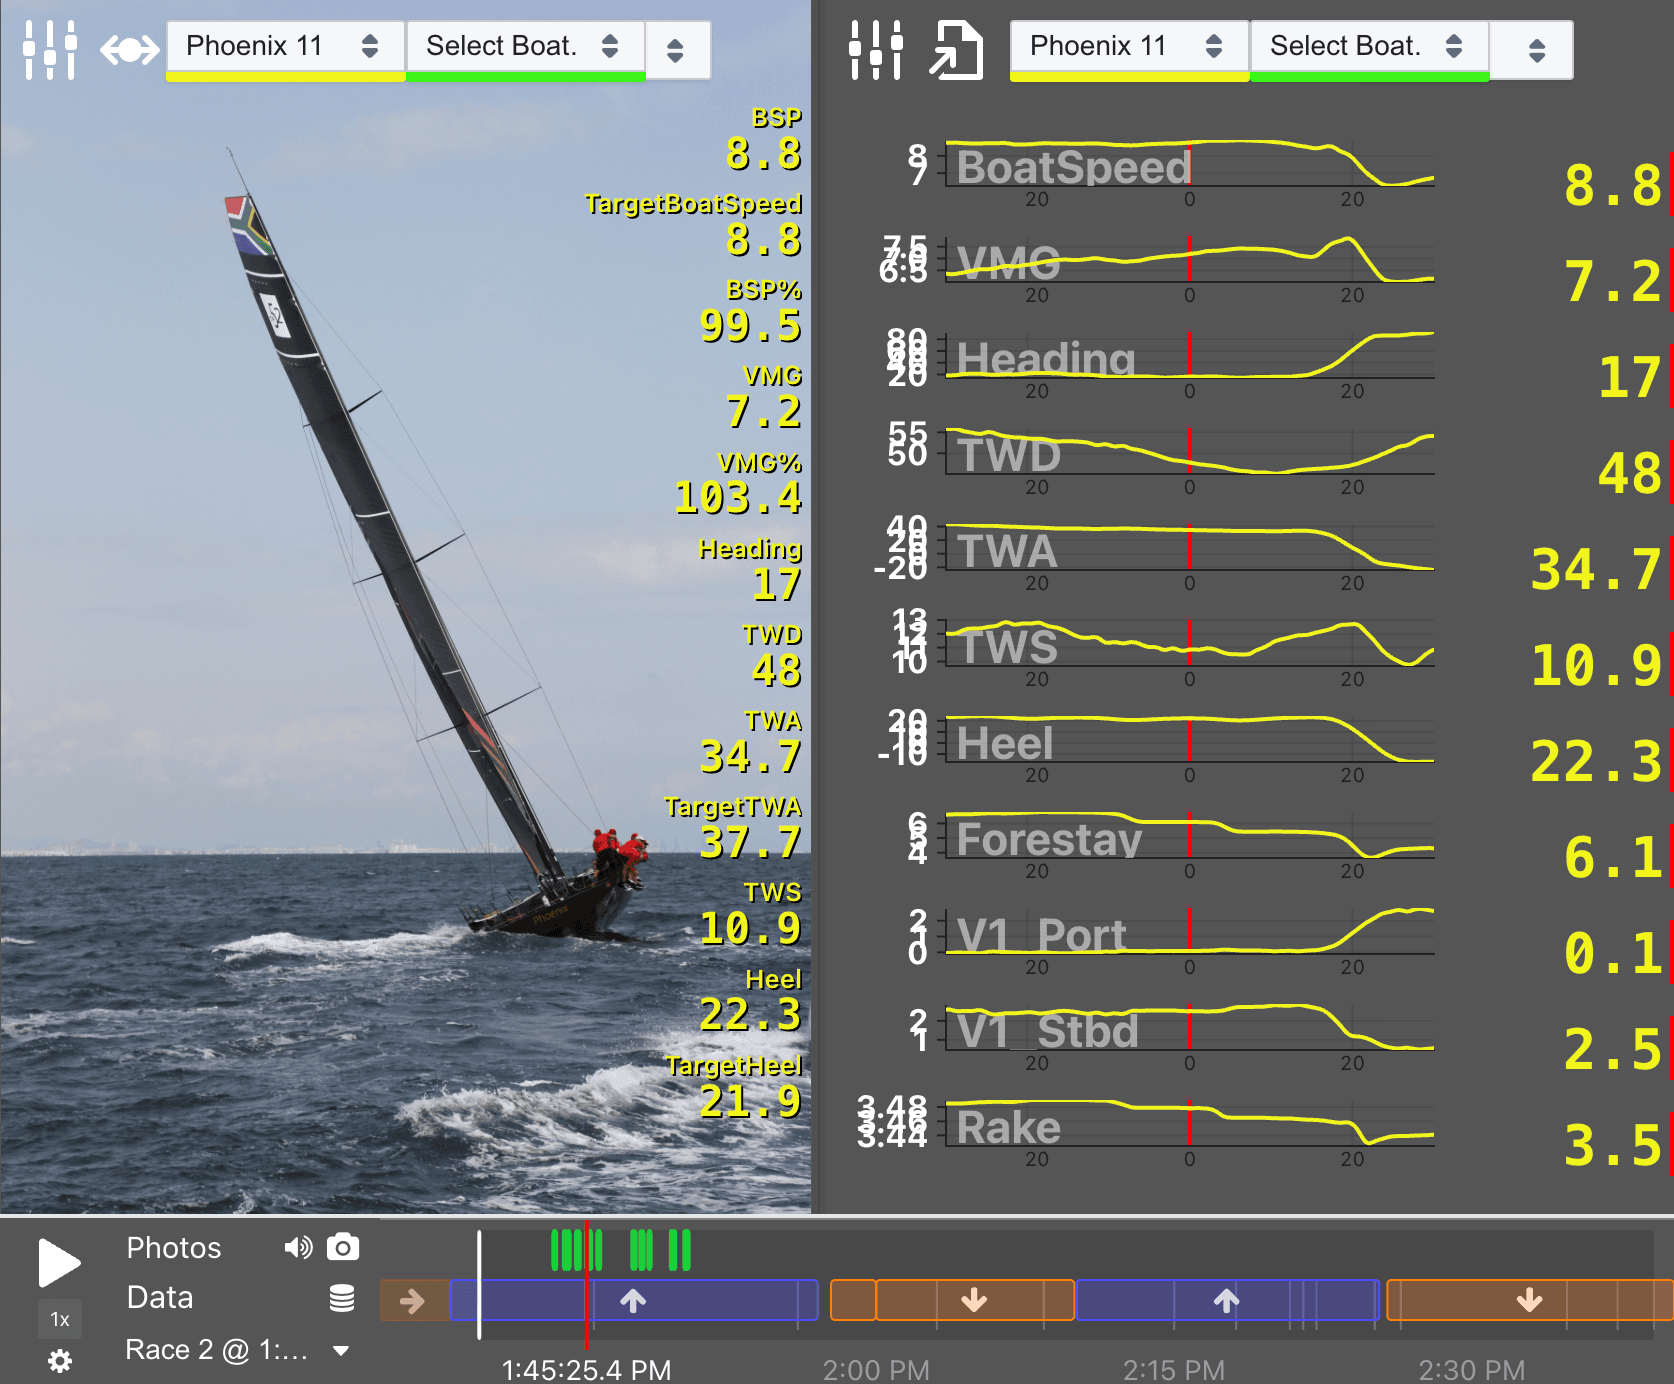
Every moment, in full context.
The race-aware timeline shows your whole day at a glance — upwind and downwind legs colour-coded, tacks and gybes marked, your comment flags visible. Jump straight to the moment that cost you positions. Every piece of footage plays in sync, with your chosen data metrics overlaid on video and photos alike.
Present across as many screens as you need. The Player file lives on disk — take it to any computer, share it with a colleague, open it without an internet connection. Video is never uploaded, so large files stay local and fast.
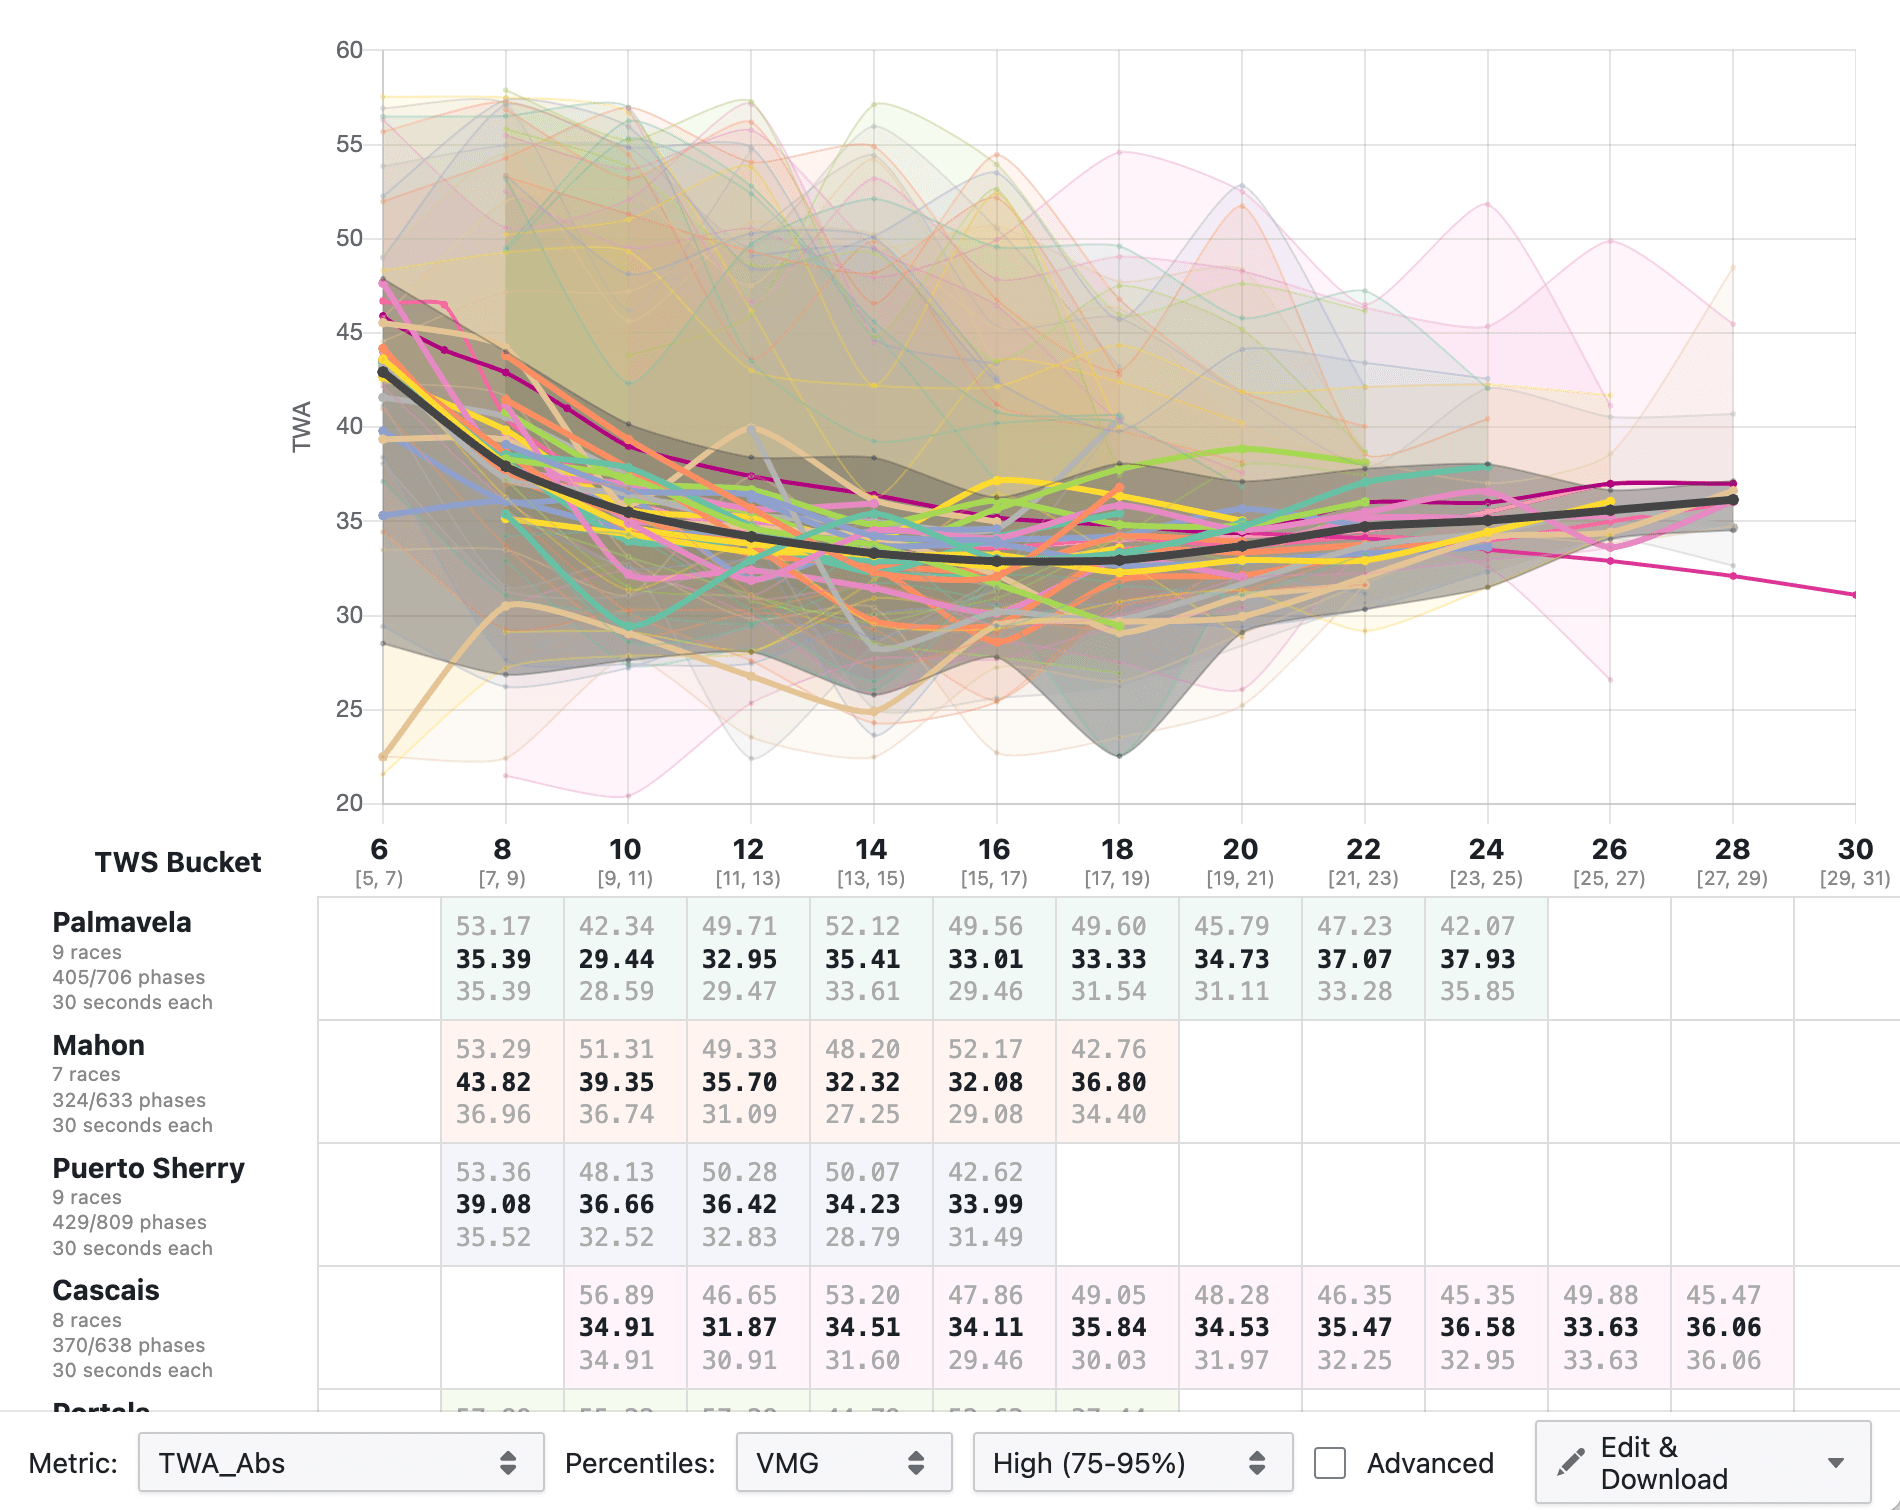
Every day builds on the last.
Each upload adds another day to your performance database. Compare baselines between events. Track how a rig change affected your upwind speed across different wind ranges. The groundwork is done automatically each time you upload — data cleaned, structured, and stored consistently.
Two products, one workflow.
Analytics and Player each have a distinct role — and a clean handoff between them.
Njord Analytics
The data hub.
Desktop browser recommended.
- Upload once, the whole team accesses via browser
- Deep analysis: maneuvers, gain/loss, tactical map, polar, calibration
- Performance database — season-long history
- Live tools: on-water comments and race timing, live data streaming
Njord Player
The debrief tool.
Desktop app (Windows/Mac) or Njord Web Player (browser, iPad, Android).
- Video + data together — any footage, auto-aligned in minutes
- Debrief presentation: multiple windows, multiple screens
- Race-aware timeline, comment markers for quick navigation
- Export: video with data overlays, batch photo export with per-frame data
Try the bundle free for 30 days.
No credit card required. Load your data, run a debrief, and see how the two products work together with your own boat's files. After your trial, you only pay for the days you sail — no seat limits, no off-season subscriptions.
Questions about getting set up? Get in touch →