Njord Analytics — Performance database
Was that fast day in Palma the conditions — or genuinely better boatspeed?
The performance database lets you compare your boat's numbers across events, conditions, and configurations — so you can tell the difference between a good day and a fast boat.
Every upload makes the picture sharper
The more you sail, the more you know.
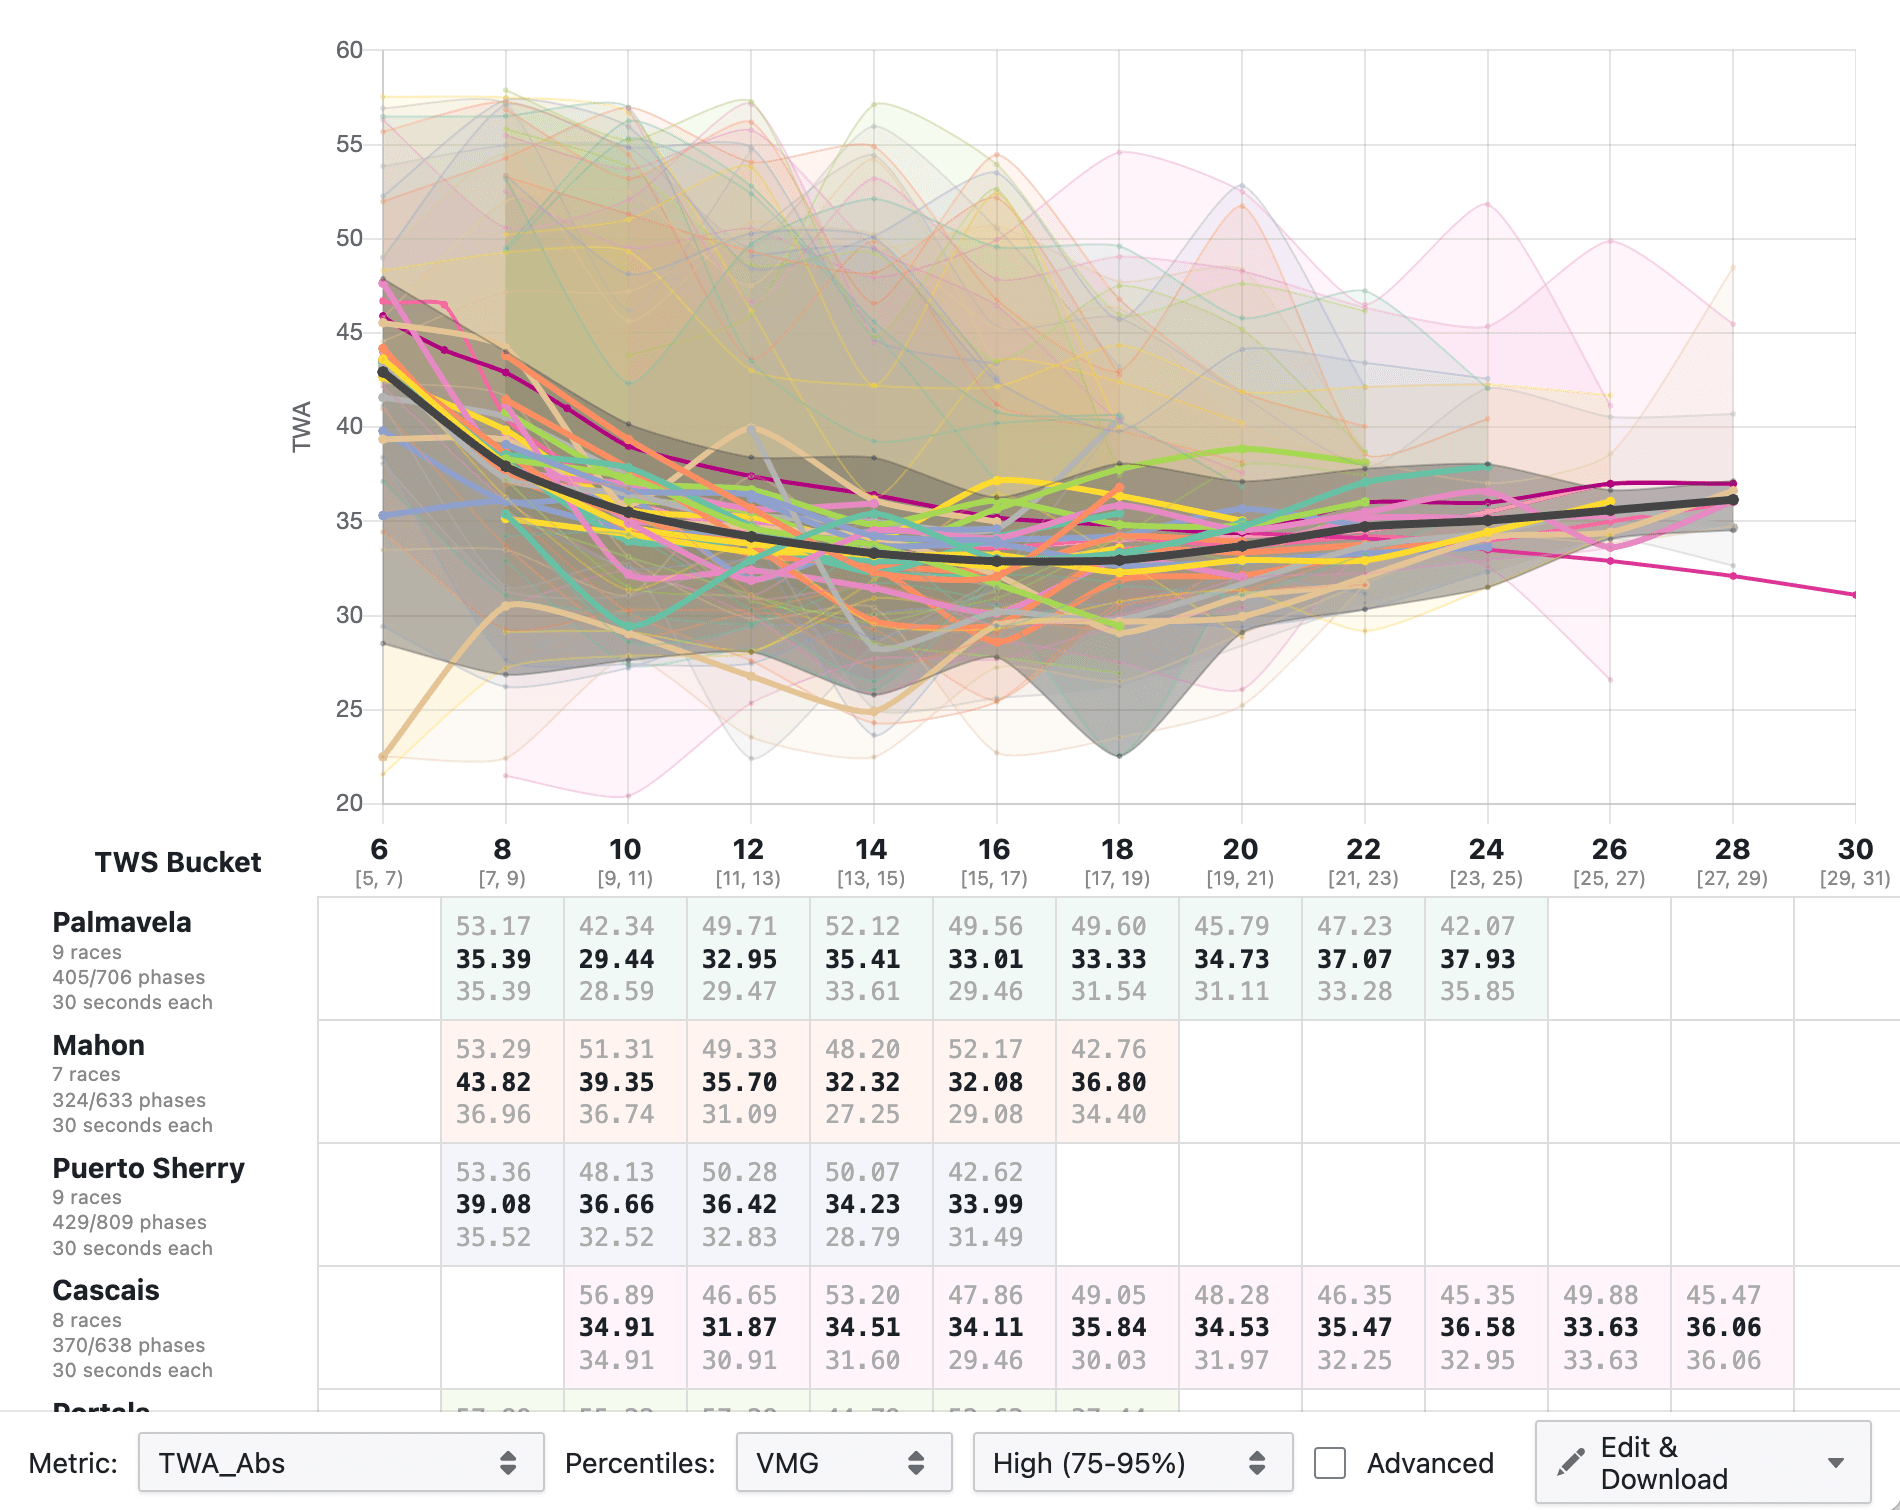
Each time you upload a day's data to Njord Analytics, it's added to your boat's performance database. Over a season, this accumulates into something you can't get from a single day's analysis — a reference library of how your boat actually performs across a range of conditions, configurations, and events.
The data is cleaned and structured consistently on upload. By the time you want to run a comparison across events, the groundwork is already done. There's no preparation step, no spreadsheet to maintain — just the data, ready to query.
The kind of questions the database answers
Specific questions. Specific answers.
Abstract 'season-long analysis' becomes concrete when you know exactly which question you're asking.
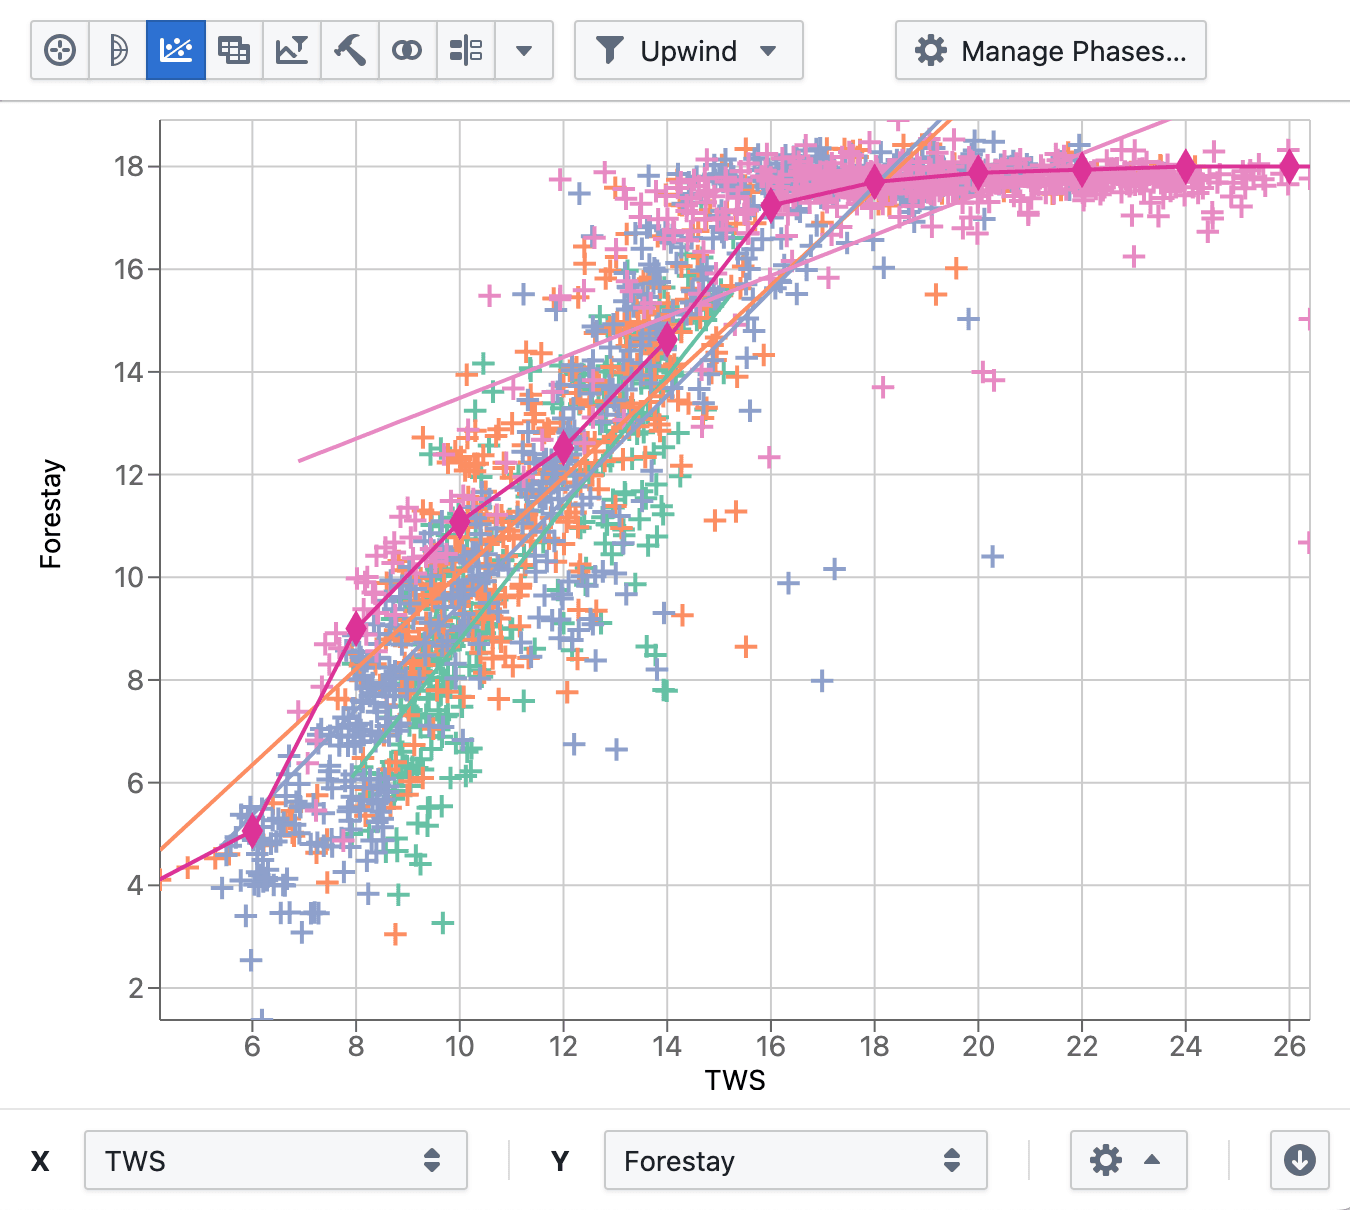
"Did the new headsail improve our upwind VMG in 10–14 knots?"
Compare this event's target and polar data against the baseline from before the change, filtered to the same wind range.
"Are we faster on starboard tack than port in breeze?"
Plot tack-by-tack boatspeed across the whole season. If the difference is there in the data, you'll see it.
"How consistent is our performance across different venues?"
Compare event baselines side by side. Outliers become obvious — and so do the conditions that explain them.
Built for the long game
Every feature you need for season-long analysis.
The longer you use it, the more it's worth.
A single day's data tells you what happened today. A season's data tells you whether today was typical, exceptional, or an outlier worth investigating. Two seasons of data starts to show you the real character of your boat — how it responds to different conditions, how setup changes actually translate to performance, where your speed comes from and where it goes.
Teams who have been using Njord for multiple seasons find themselves with a resource few rivals have — a detailed, queryable history of their boat's performance that they can use to make better decisions faster, in the boat and out of it.
The database starts building on day one.
Every sailing day you upload is a day added to the record. Start now and the database grows with every session — there's no better time to begin than before the next regatta.