Njord Analytics
Why did you lose those three seconds on the second upwind?
Now you can answer it. Precisely. Njord Analytics connects your boat's data with your memory of the day — so every question you leave the water with has an answer waiting when you get back.
Daily workflow
Upload your data. You're immediately in the race.
Load your log file and Njord goes to work — detecting races and legs automatically, so you can navigate directly to the moment that matters.
Upload
Drop your log file via browser upload or email. Races and legs are detected automatically — no manual configuration needed to get started.
Explore
Click into any race, any leg, any maneuver. Switch between visualisation types without losing your selection. The analysis follows your question.
Share
Share a link or send a report. Your whole team can access the data — no seat limits.
Visualize data
Go as deep as you need to.
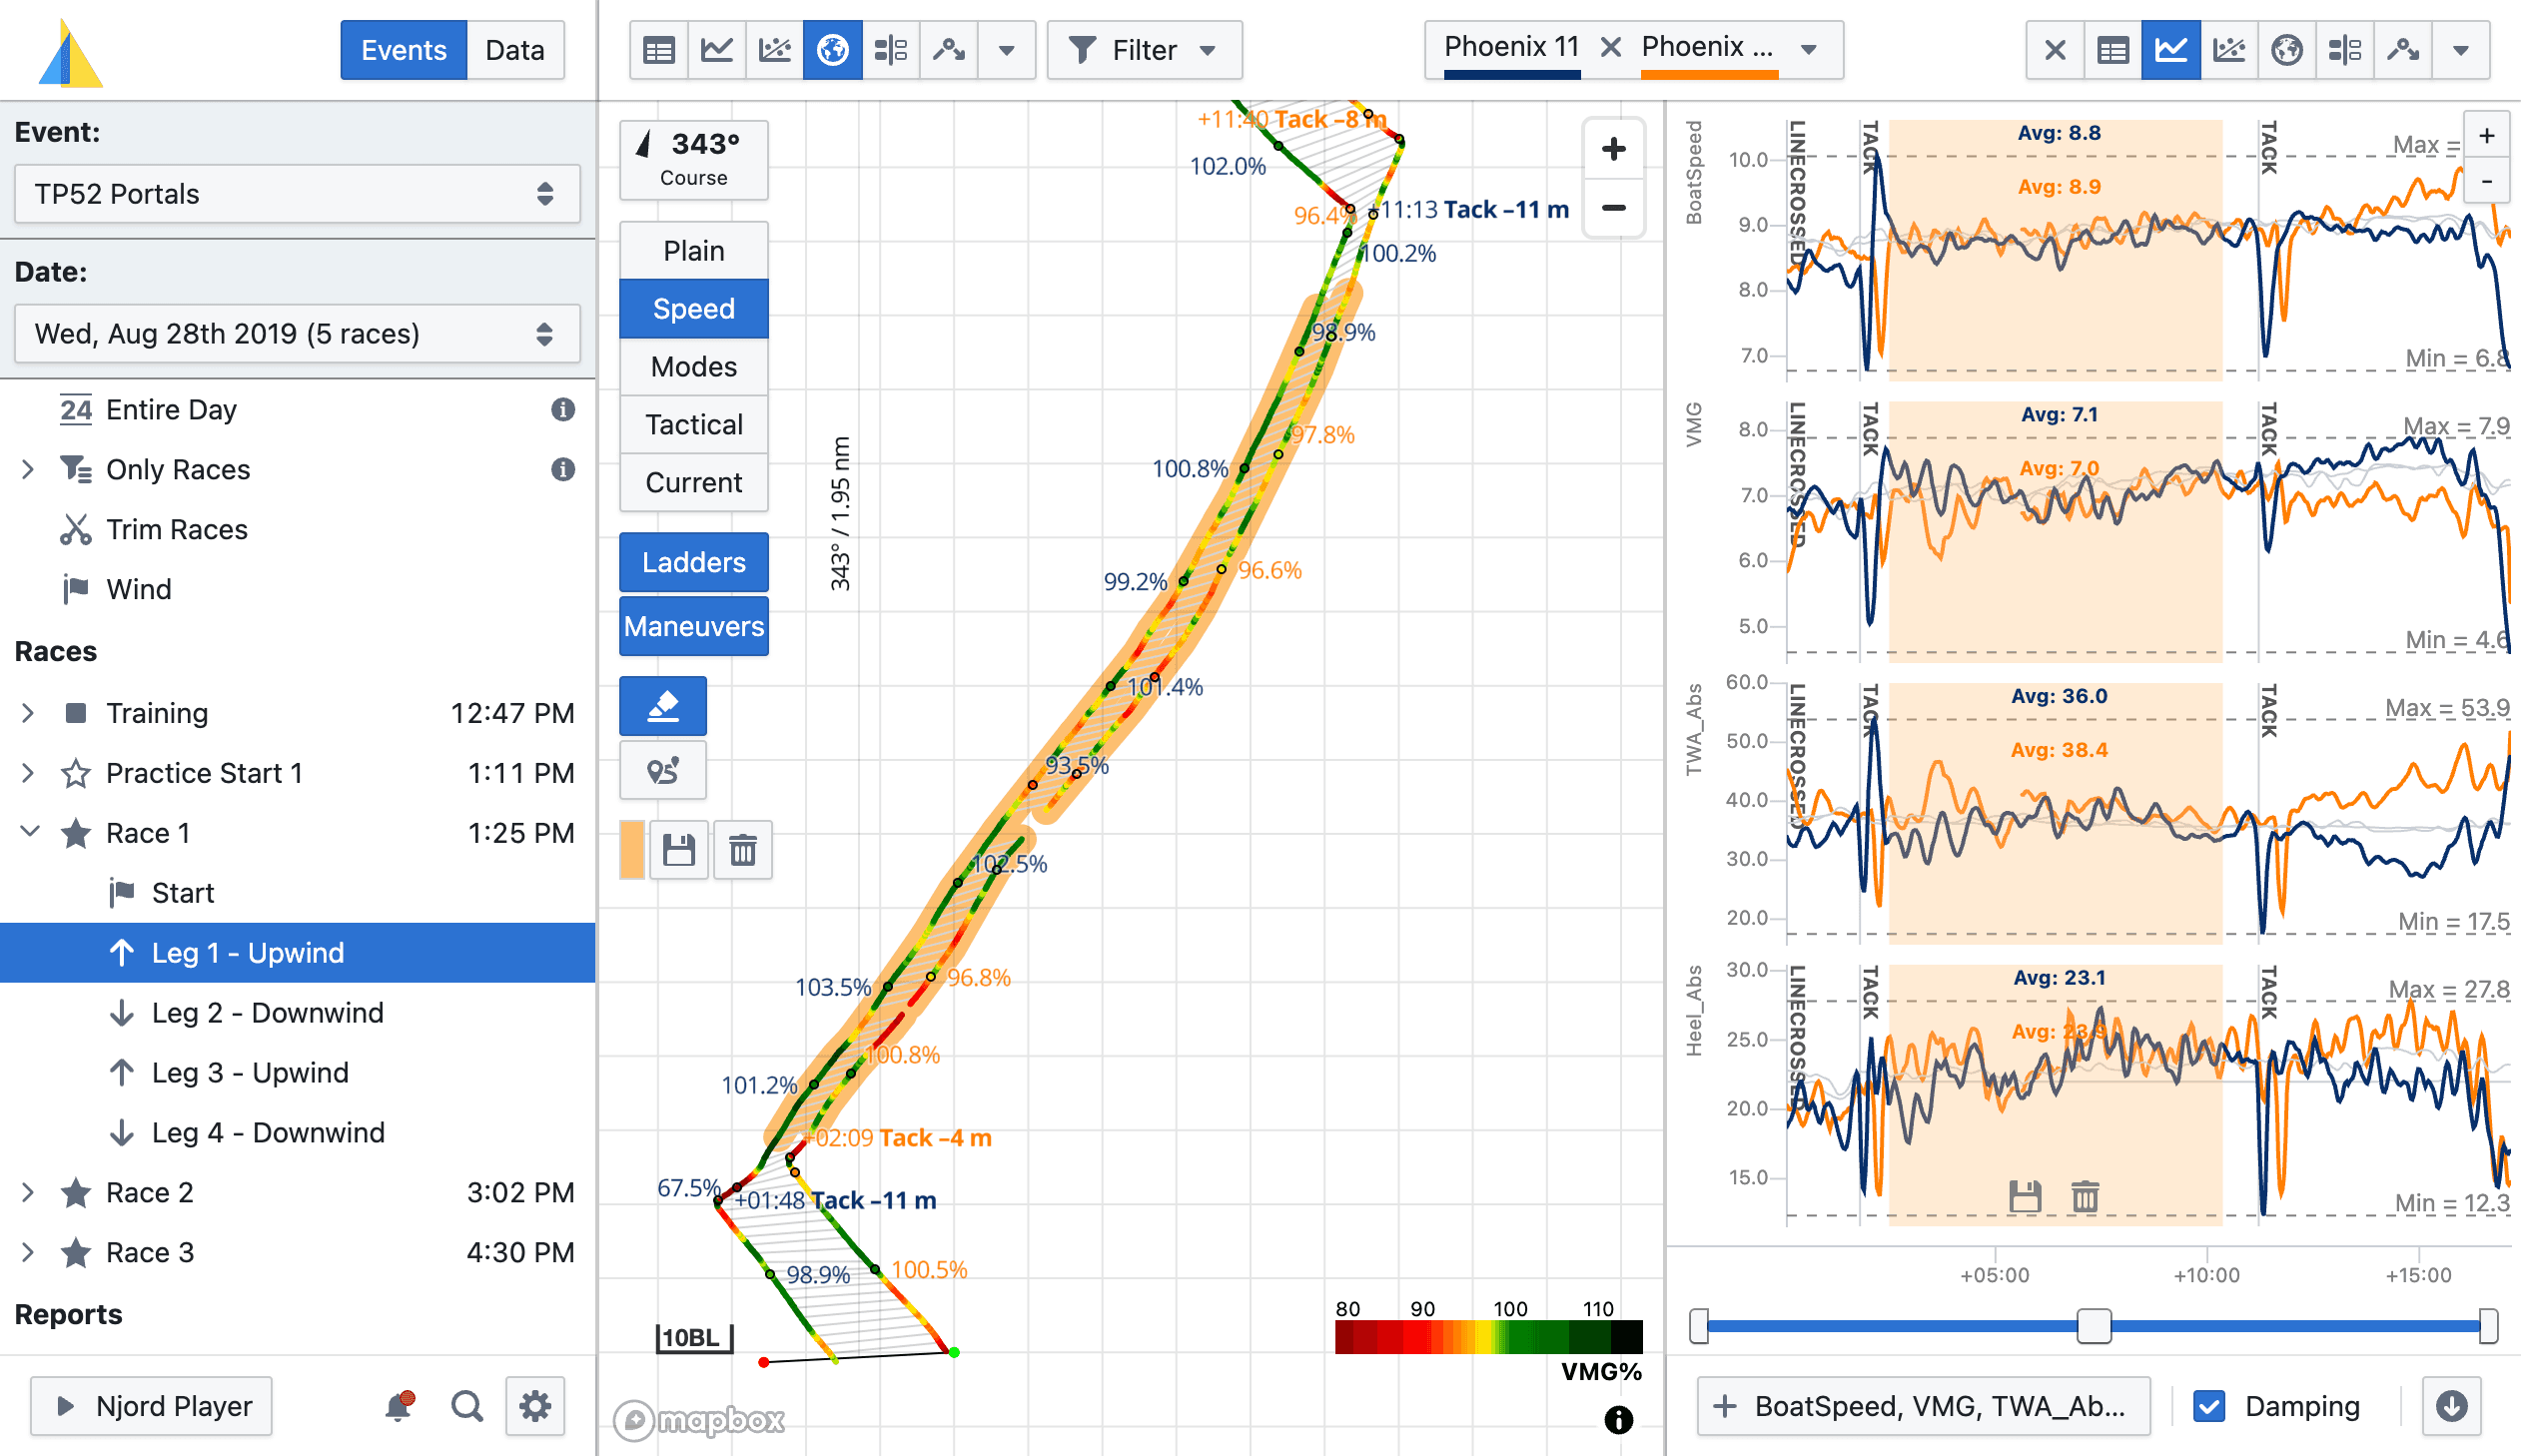
A rich set of interactive visualisations — map, line chart, scatter chart, polar diagram, statistics, and more. Click anywhere to drill in; every view updates together.
Zoom into a lineup. Overlay boatspeed, heel, and TWA on the same chart. Highlight a section of the track and see statistics for just that segment. The analysis follows your question, not the other way around.
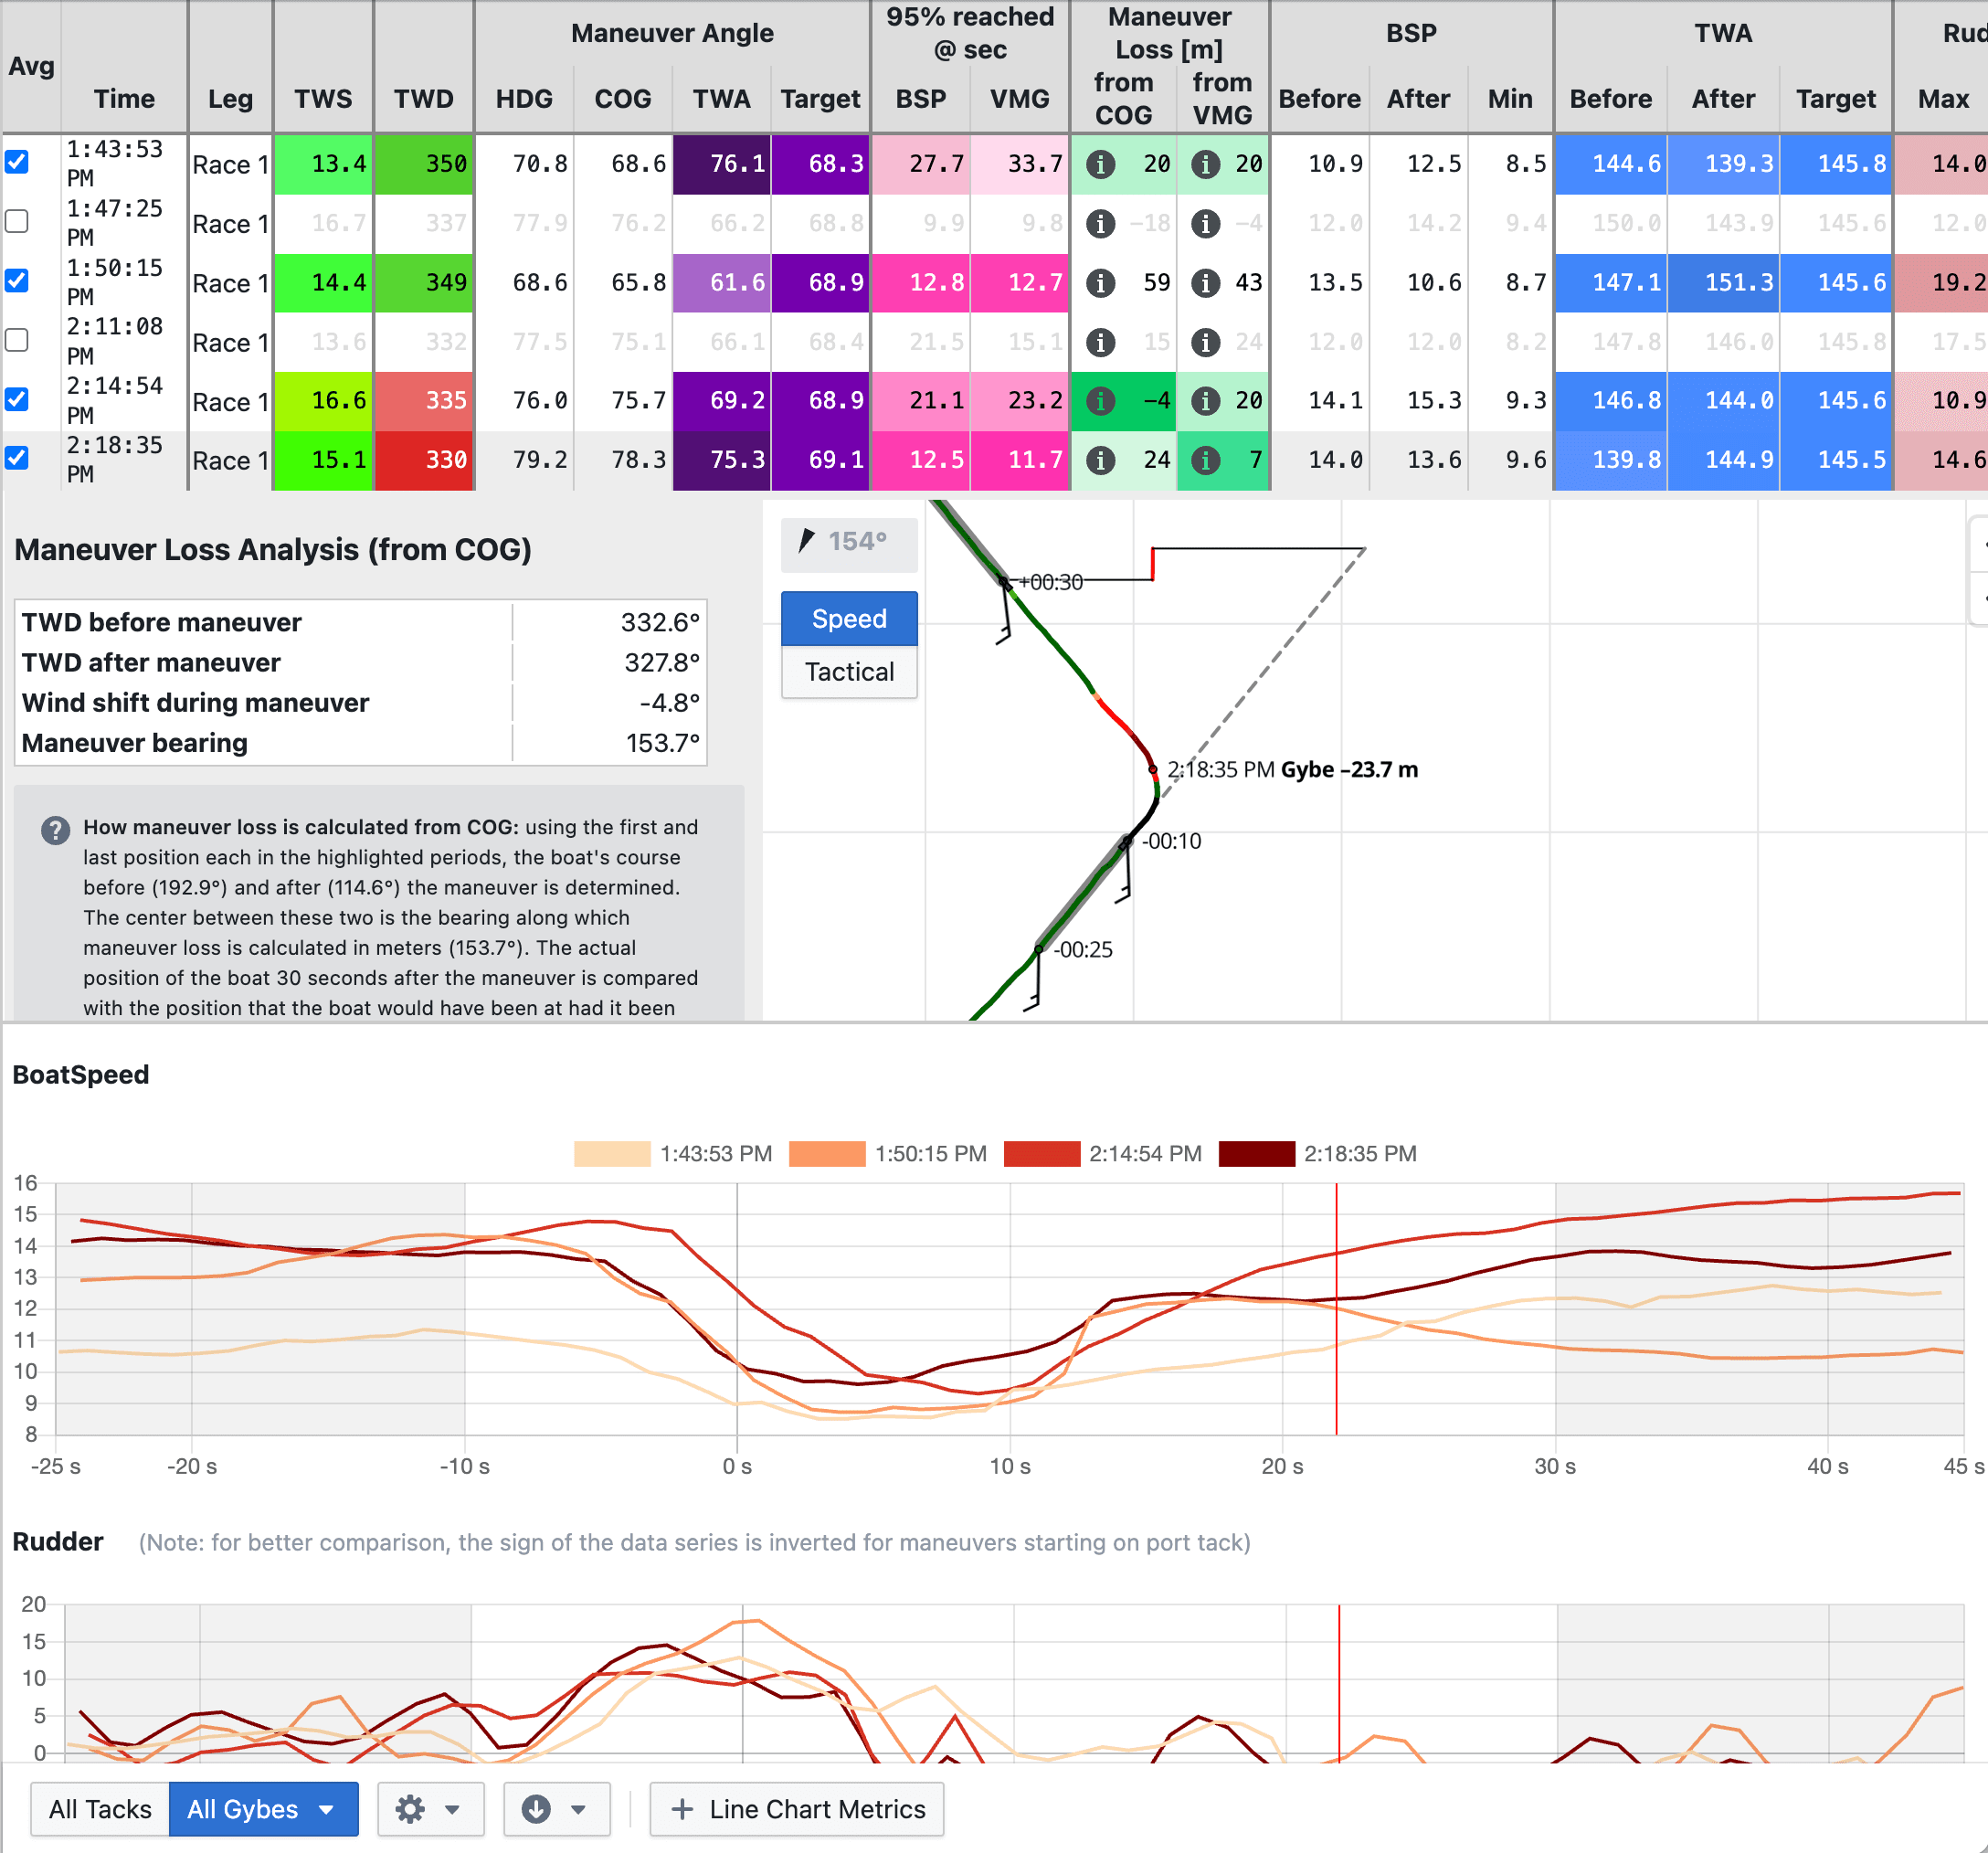
Maneuver analysis
Find your best maneuver. Understand your worst.
Every tack and gybe from the day, automatically detected and ranked by loss.
Njord takes every maneuver and aligns them on the same chart — head-to-wind for tacks, stern-to-wind for gybes — then overlays line charts of your chosen metrics across all of them simultaneously. Which ones were clean and which cost you distance is immediately visible.
Training with partner boats? Compare maneuvers between boats in the same session — the same conditions, different outcomes — and see exactly where the gap comes from.
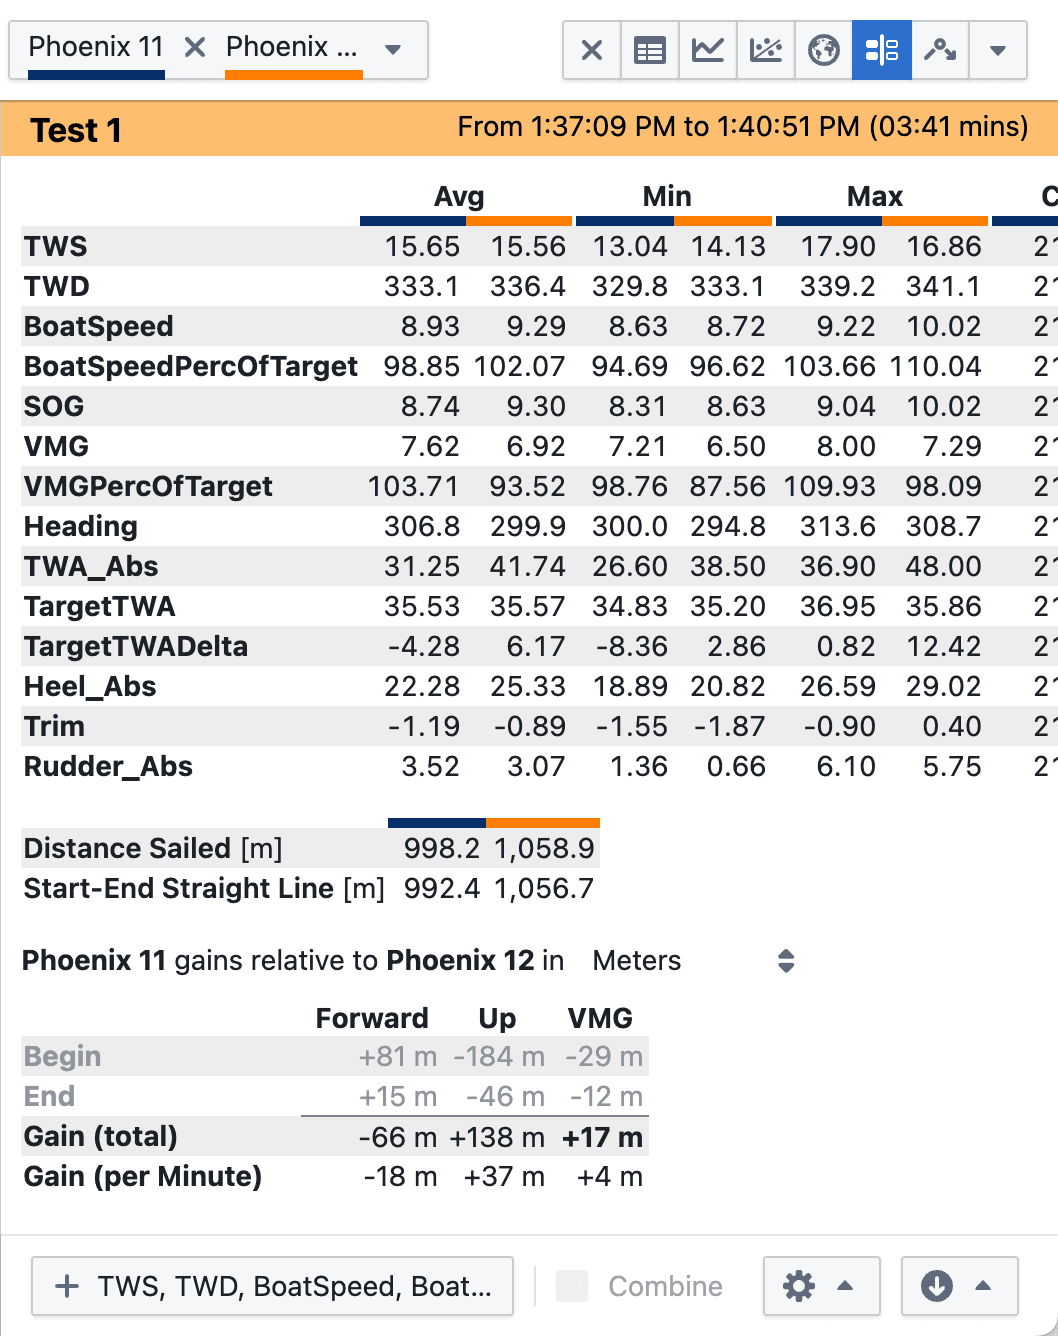
Gain/loss analysis
See exactly where the race was won and lost.
Compare any two boats over any period of time — your own training partners or a competitor.
Plot relative gain in forward, sideways, or VMG direction. The gain/loss view shows metric averages, min and max for each boat, and their relative positions over time — so you can see not just that one boat pulled ahead, but what they were doing differently.
If fleet tracking data is available from your event — via TracTrac, GeoRacing or others — compare yourself directly against the boats around you on the course.
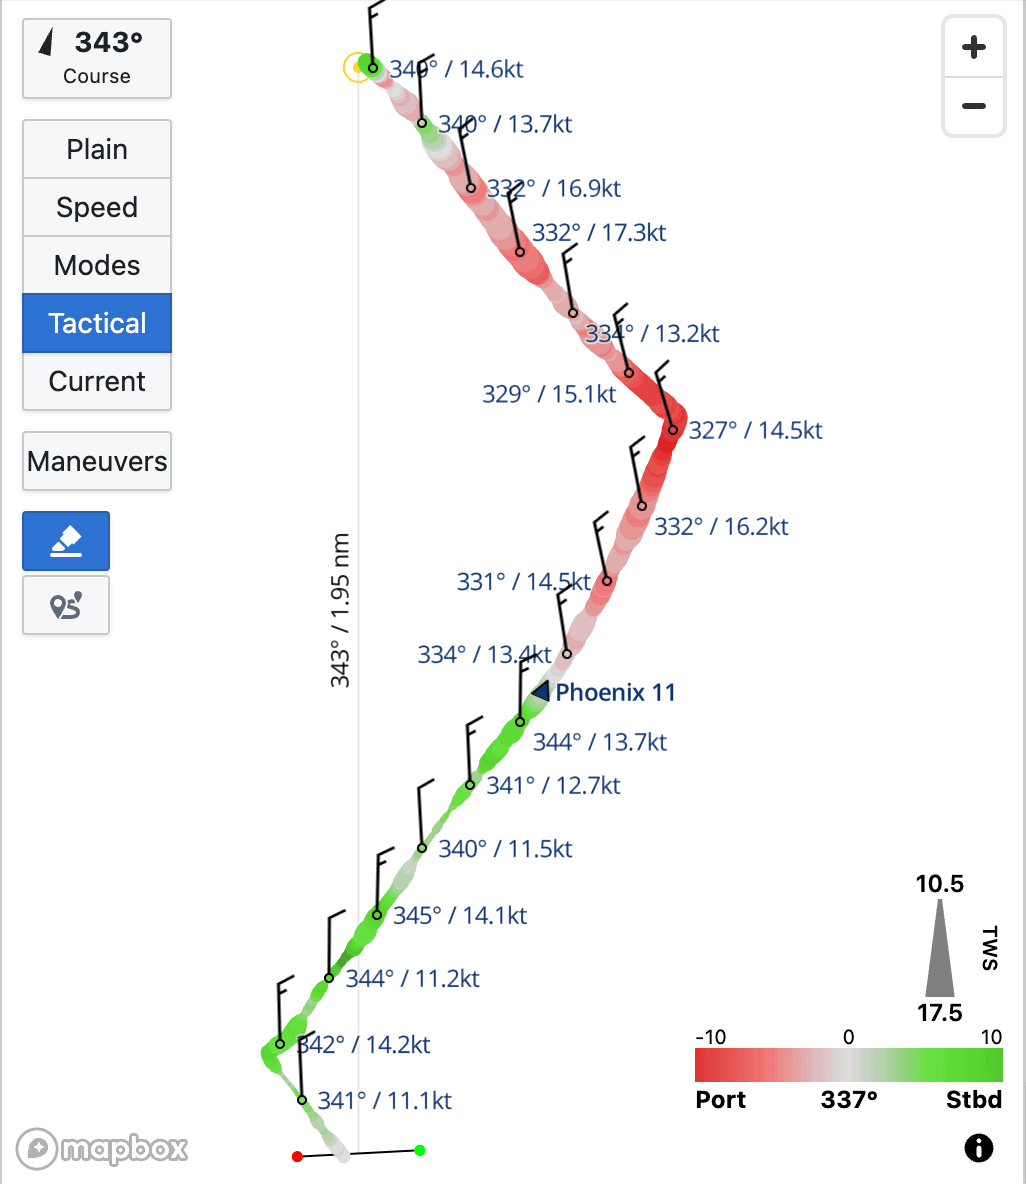
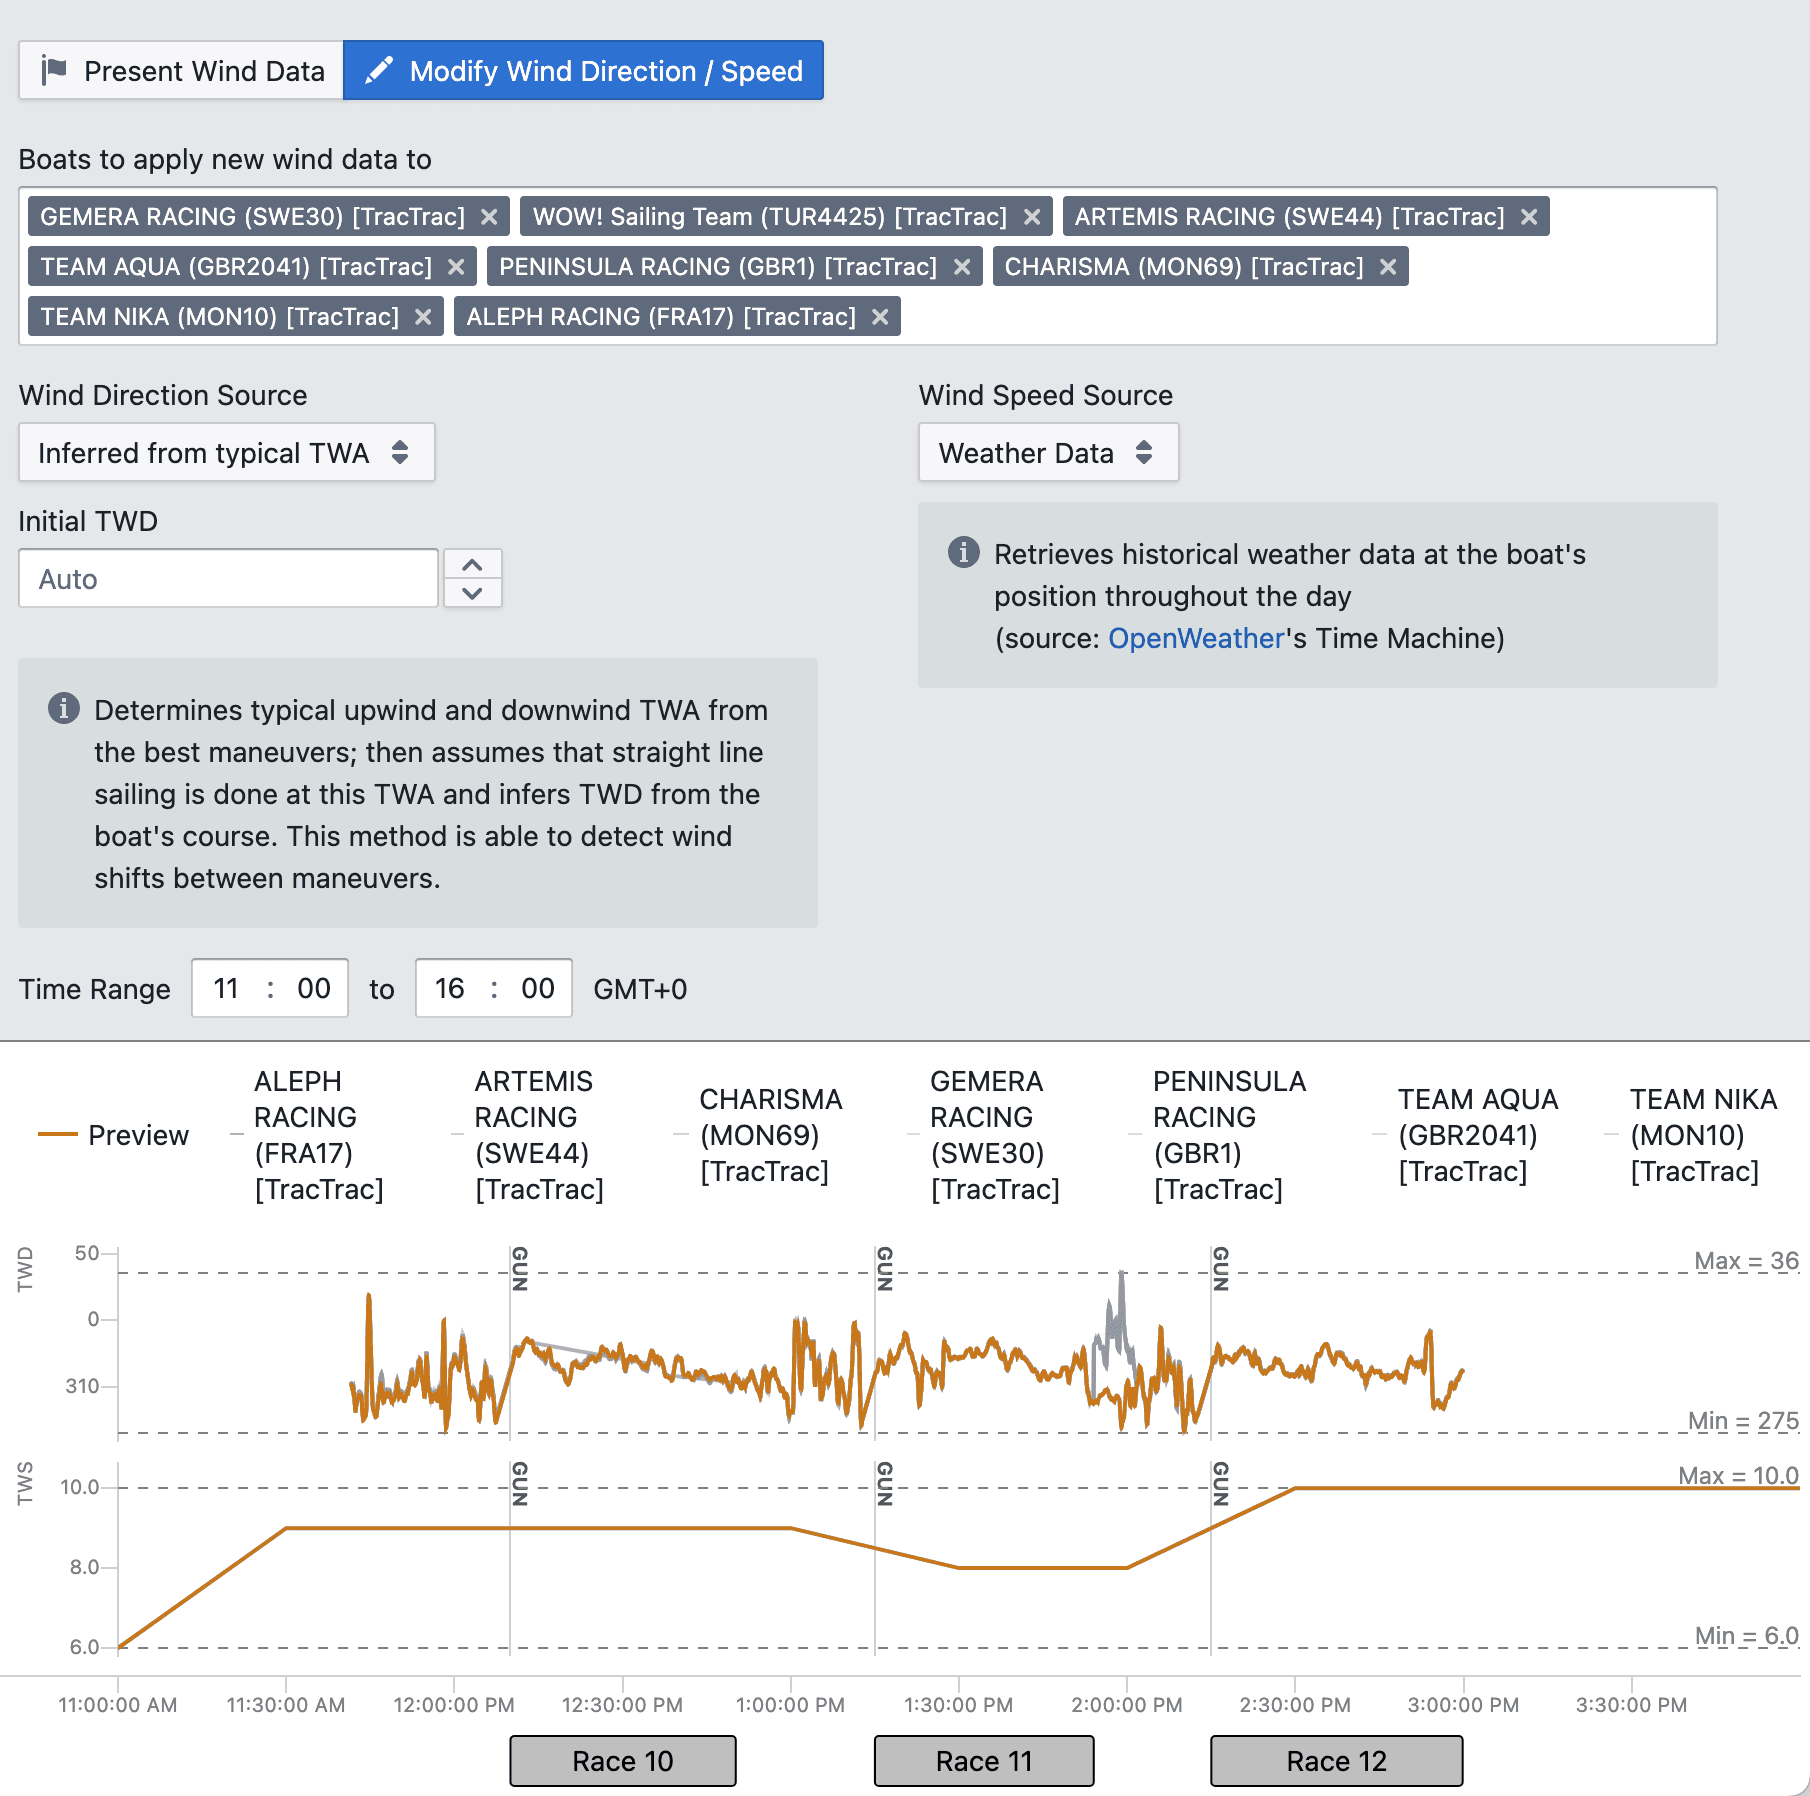
Wind data
No wind instrument? Not a problem.
True wind direction is the key that unlocks the most powerful parts of Njord Analytics — leg detection, maneuver analysis, VMG, and more.
If your boat doesn't record wind data, Njord can reconstruct true wind direction from maneuver angles and upwind/downwind target angles. Once added, legs are detected automatically, maneuver analysis unlocks, and VMG numbers become meaningful.
You can also load wind data captured on a coach boat or from a fixed weather station alongside your own log file.
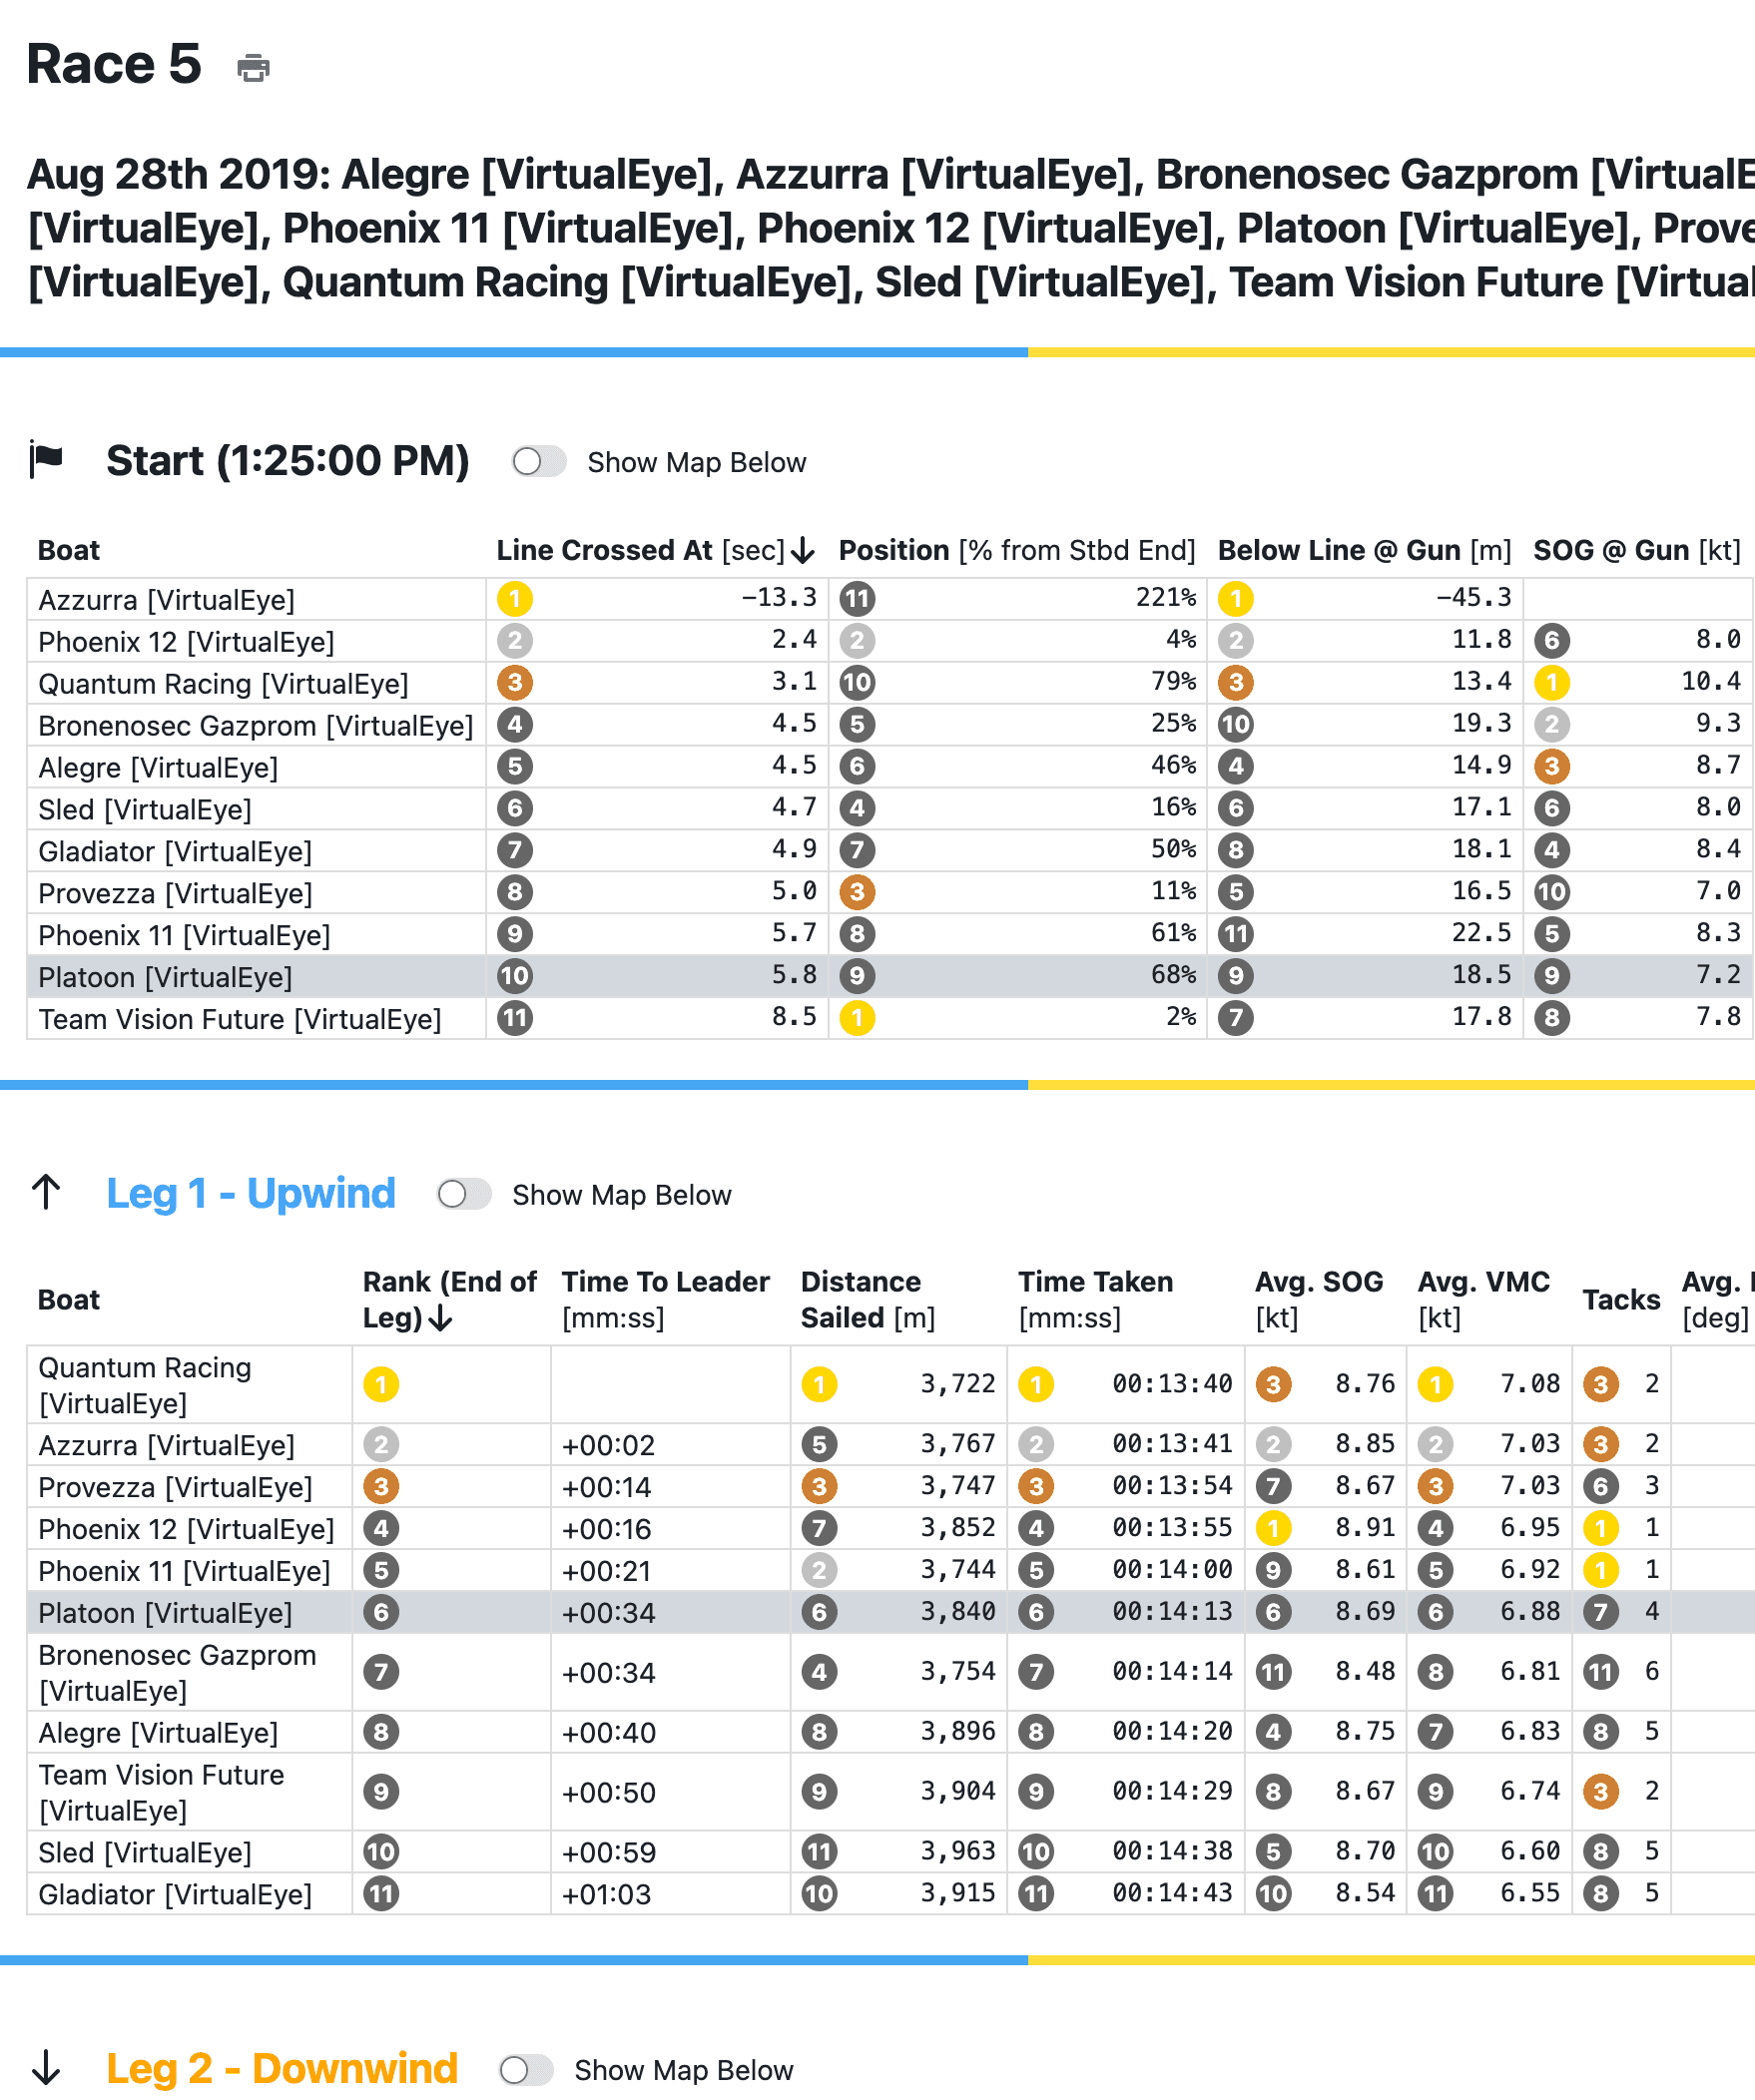
Fleet race report
See how the whole fleet moved.
Using fleet tracking data, compare distance sailed, average speed, and ranks gained or lost on each leg — across every boat in the race.
Understand not just where you finished, but how you got there relative to the boats around you. The fleet race report covers starts too — see who crossed early, who was below the line at the gun, and how the fleet spread across leg 1.
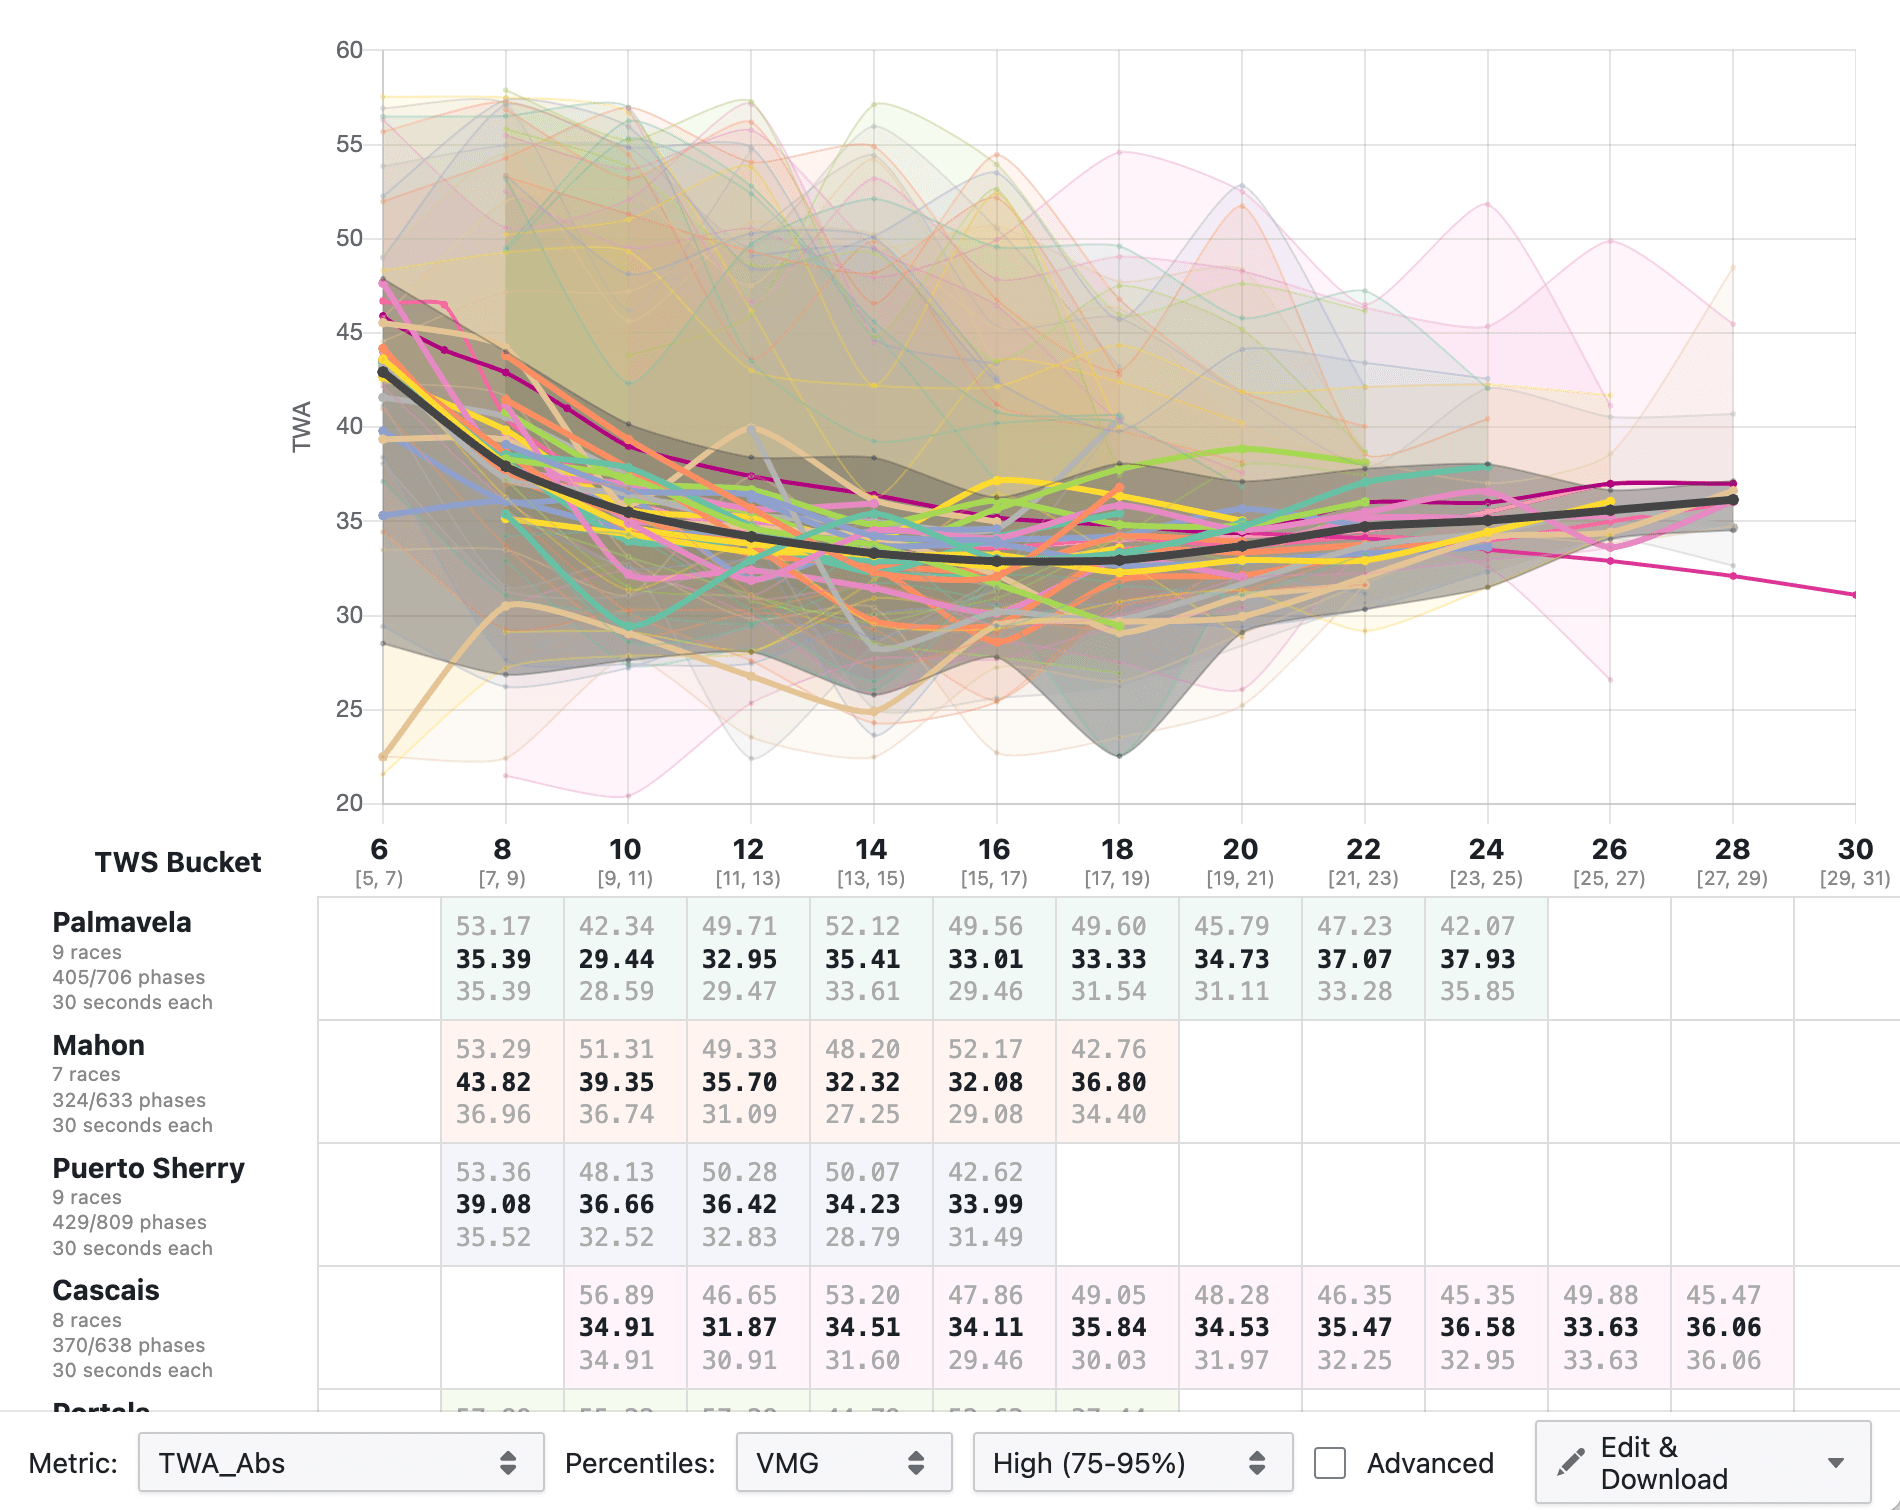
Performance database
Your boat's performance history, always at hand.
Every day you sail with Njord, you're building something more valuable than just that day's analysis.
The performance database aggregates your data across an entire season — or multiple seasons. Compare target angles across wind speed ranges. Track how a rig change affected your upwind numbers. Build polars from your own sailing rather than class defaults.
Each day's data is processed and stored consistently on upload — so by the time you want to run a season comparison, the groundwork is already done.
More features
Trust your numbers.
Instrument calibration
Automated calibration reports flag suspect instrument readings and suggest offsets — so your analysis is based on data you can trust, not artefacts from a sensor that drifted.
Polar editor
Edit and export polars directly in Njord, with access to the ORC database. Export targets to Expedition and other supported formats. Build from your own data or start from a class default.
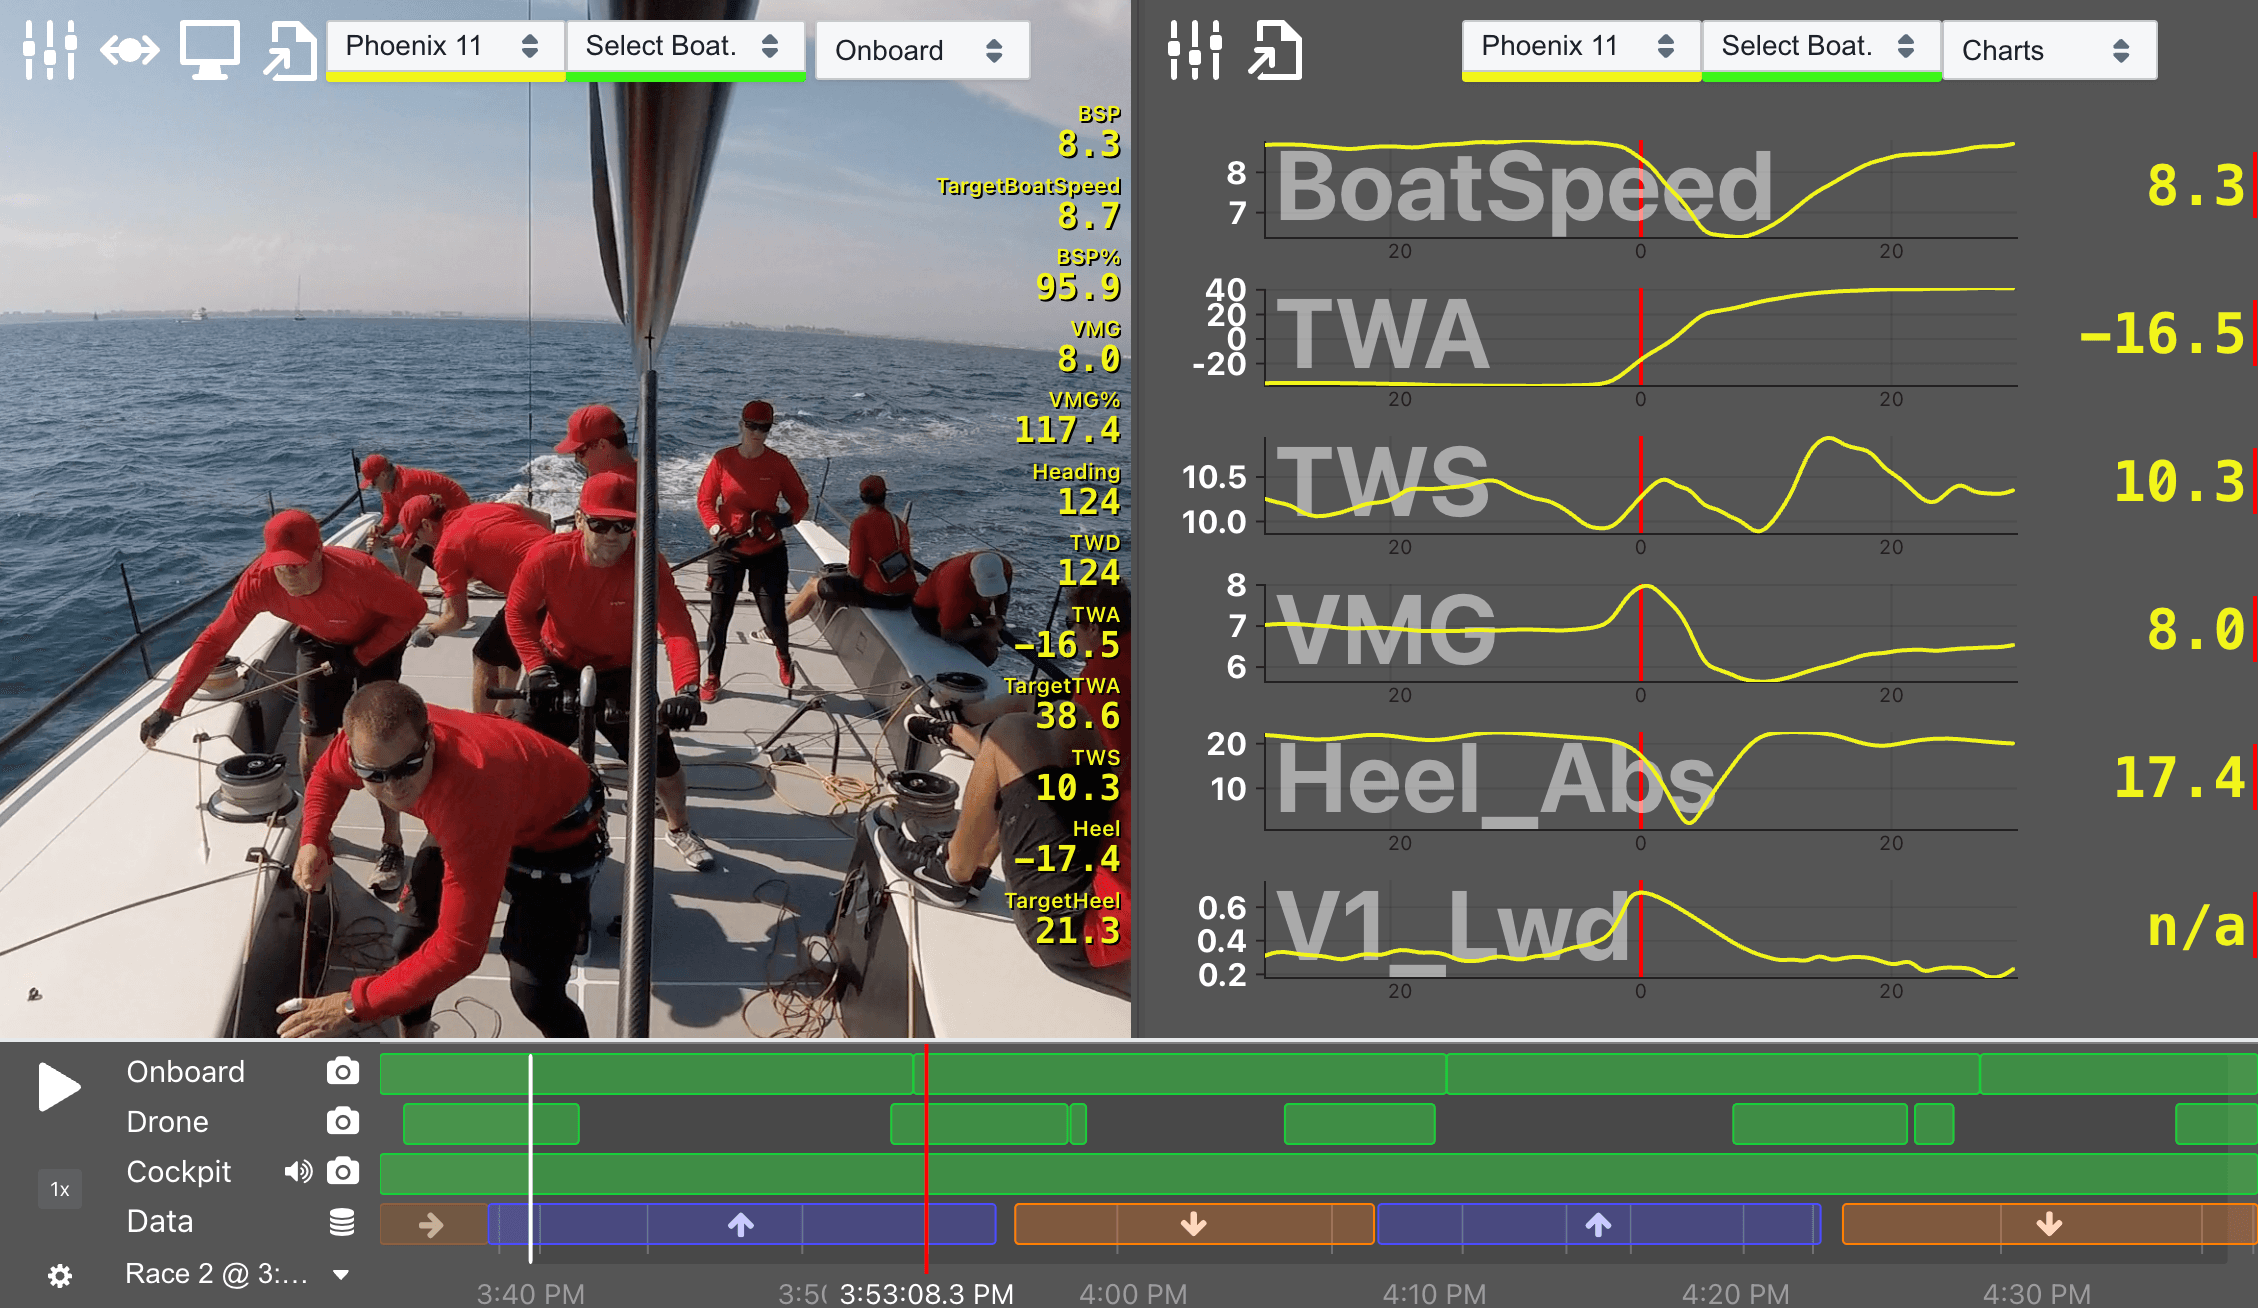
Better together
Pair it with Njord Player.
When you use Analytics and Player together, your boat data, race times, and comments stay in sync across both. Analyse the numbers in Analytics. Walk into the debrief with the footage in Player. Your team sees the full picture — data and video, on the same timeline.
Start with your own data.
Your first sailing days are free — no credit card, no time limit on data you've already loaded. After that, you only pay for the days you sail.